
What is a video heatmap?
A video heatmap is a visual representation of data using color-coded values. It offers a condensed overview of information by presenting it in a graphical format.
Heatmaps are an effective tool for distinguishing between interested and disengaged viewers.
On the private hosting platform of Cincopa, each video view generates a video heatmap that provides a detailed second-by-second analysis of the viewer’s behavior. The heatmap includes viewer details, contextual information such as the location and time of video playback, and a color-coded timeline illustrating the viewer’s interaction with the video.
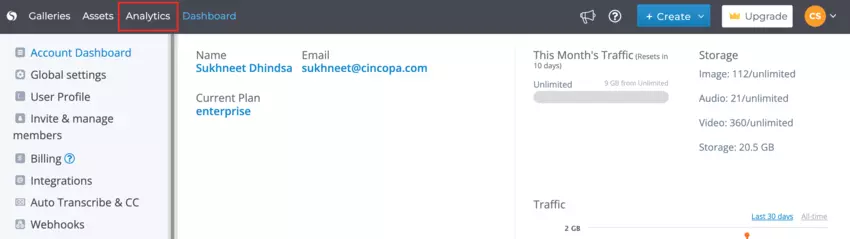
To access the Heatmaps, simply log in to your Cincopa account and click on Analytics.
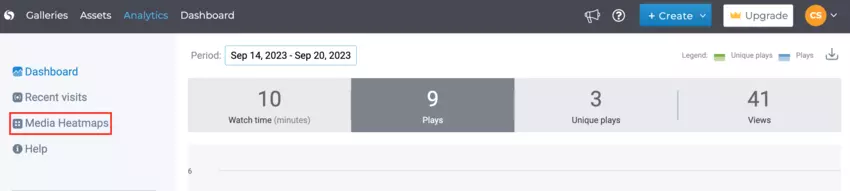
On analytics, click on ‘Video Heatmaps’.
Then, all you need to do is choose which video you want to see the heatmaps for, and you will receive all the information regarding your viewers’ engagement. Click on any video to view its data.
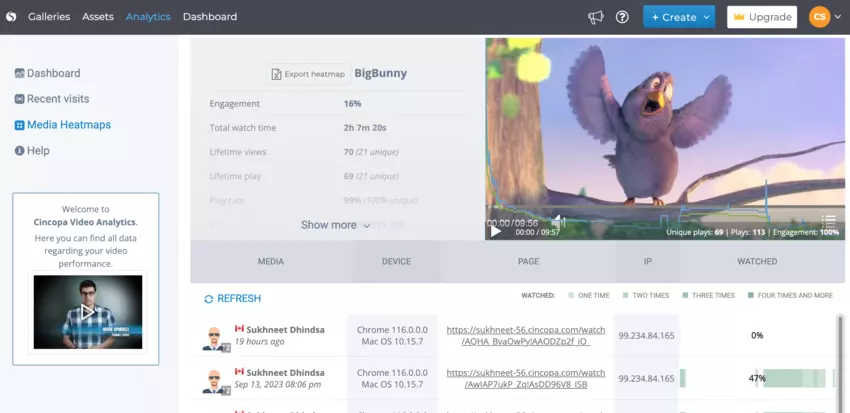
White, green, orange, and red colors indicate the level of interaction, with hotter colors representing higher engagement. You can identify whether viewers have skipped specific sections and rewatched others, track the number of videos they have watched, access viewer demographics, and determine if they have clicked on a call-to-action.
Opting for a paid video hosting service provides numerous advantages that free services lack, such as enhanced security, customization options, and comprehensive analytics, including the utilization of video heatmaps.