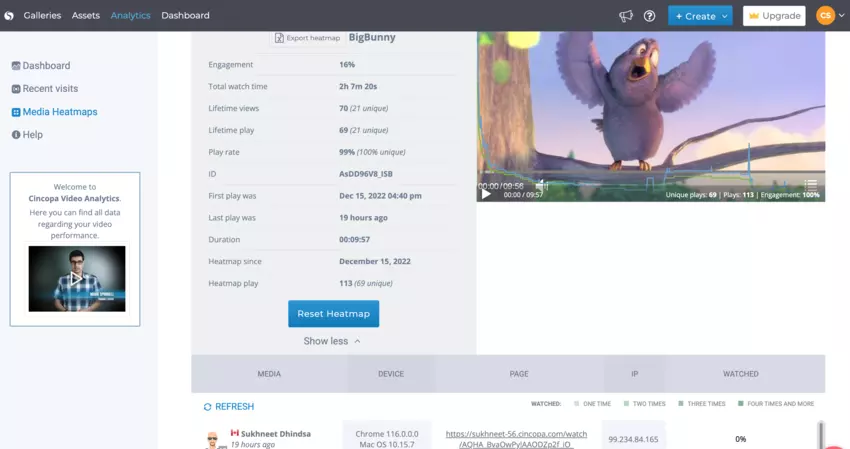
Analytics Dashboard
Cincopa Video Analytics dashboard shows aggregate video stats within a selected timeframe. For your convenience, data is presented in a graph, which is perfect to comprehend how stats change in dynamics.
Watch time shows the total viewing time of video videos in hours. Views are recorded each time a user plays a video. Unique views refer to the number of unique users who have played videos. The Impressions graph is helpful in understanding how many times web pages containing your embedded videos have been loaded by users.
Below the graph, there is a table with detailed stats. You can sort them by video, page, domain, and geography. Check out heatmaps showing how user-engagement changes for each video from start to end.
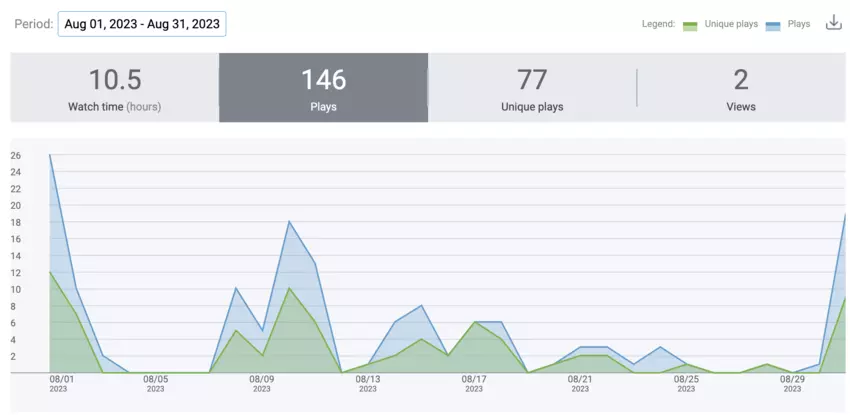
Cincopa allows its users to analyze the statistics of every individual video. This means you can now access the viewer’s information who accessed your Cincopa Videos.
Why do you need Analytical Data for your Videos?
Understanding how your audience interacts with video is the key milestone in successful marketing. With Cincopa Video Analytics, you can be sure that your videos not only look great but also deliver excellent marketing results.
And the result always depends on how well you comprehend viewers’ preferences and use this intelligence to create really engaging video content.
How to export a specific video’s analytics (viewers & aggregated data)?
You can not only view a specific video’s analytical data but also export them in a CSV file so you can use it for external purposes.
Let’s look at how to export a particular video’s analytical data:
Log in to your Cincopa account and then click on Assets
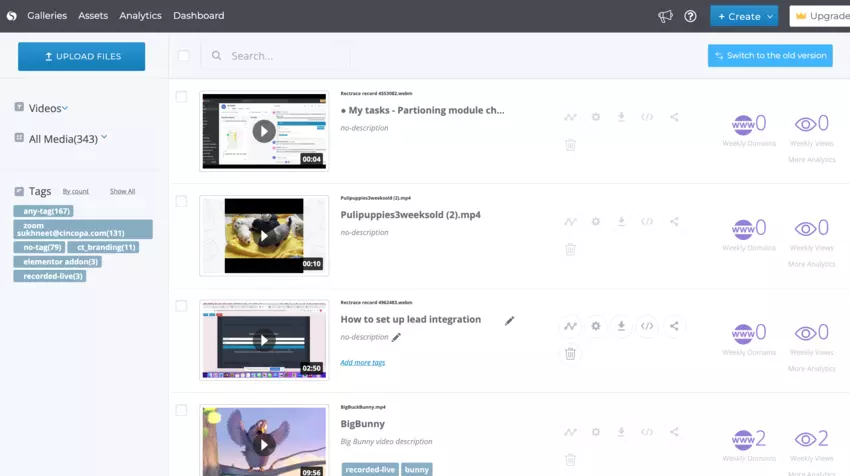
Now scroll down and search for the video for which you would want the Analytical Data and then click on the Analytics icon

Here you can view your video analytics information. Click on Show More to see more details.
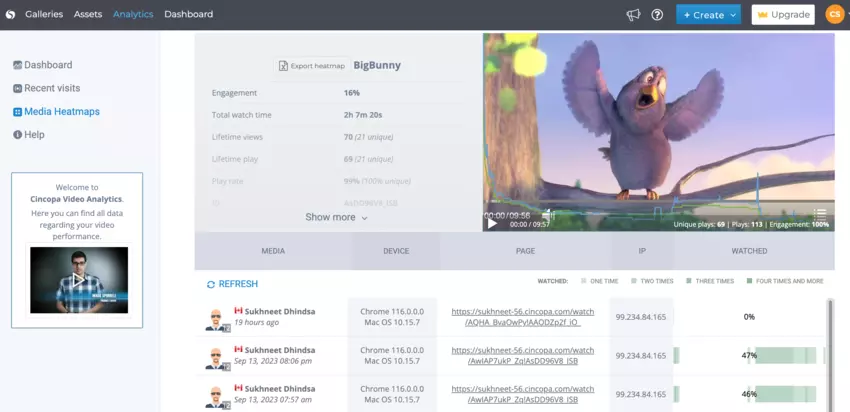
Here you can click on the Export button to export these analytical data.
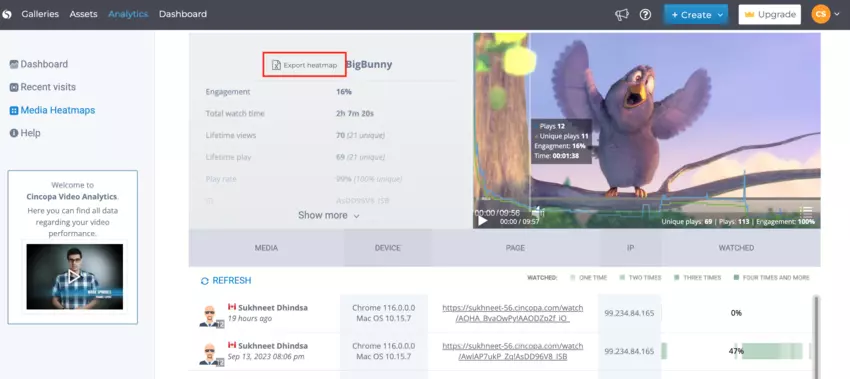
After clicking on Export the .csv files will be downloaded to your downloads folder.


