Video is the undisputed king of content formats. Our brains are wired in a way that makes us far more likely to retain visual content than text. Accordingly, people stay on a website for as much as two minutes longer and are about 64% more likely to purchase something when it is presented using video.
Video engagement, however, is a great place, to begin with.

What is video engagement?
Video engagement is considered the primary factor that determines how much information viewers will retain from videos they watch. In other words, the number of viewers who both stay to view your content and don’t tune out in the middle of your presentation. It goes without saying, that the higher the video engagement, the higher the effectiveness of the video.
Companies can set certain aside certain elements that define user interaction and engagement. These can include a number of viewers retained over that period or the number of clicks your banner receives. Since this is not a consistent metric (and some companies’ videos’ run time is less than ten seconds) you may want to measure engagement in other ways. Actions like liking the video, sharing and subscribing are all viable, valid options.
Depending on the kind of data your video host provides, there are a lot of other metrics that can be put into the mix to fine-tune the data output.
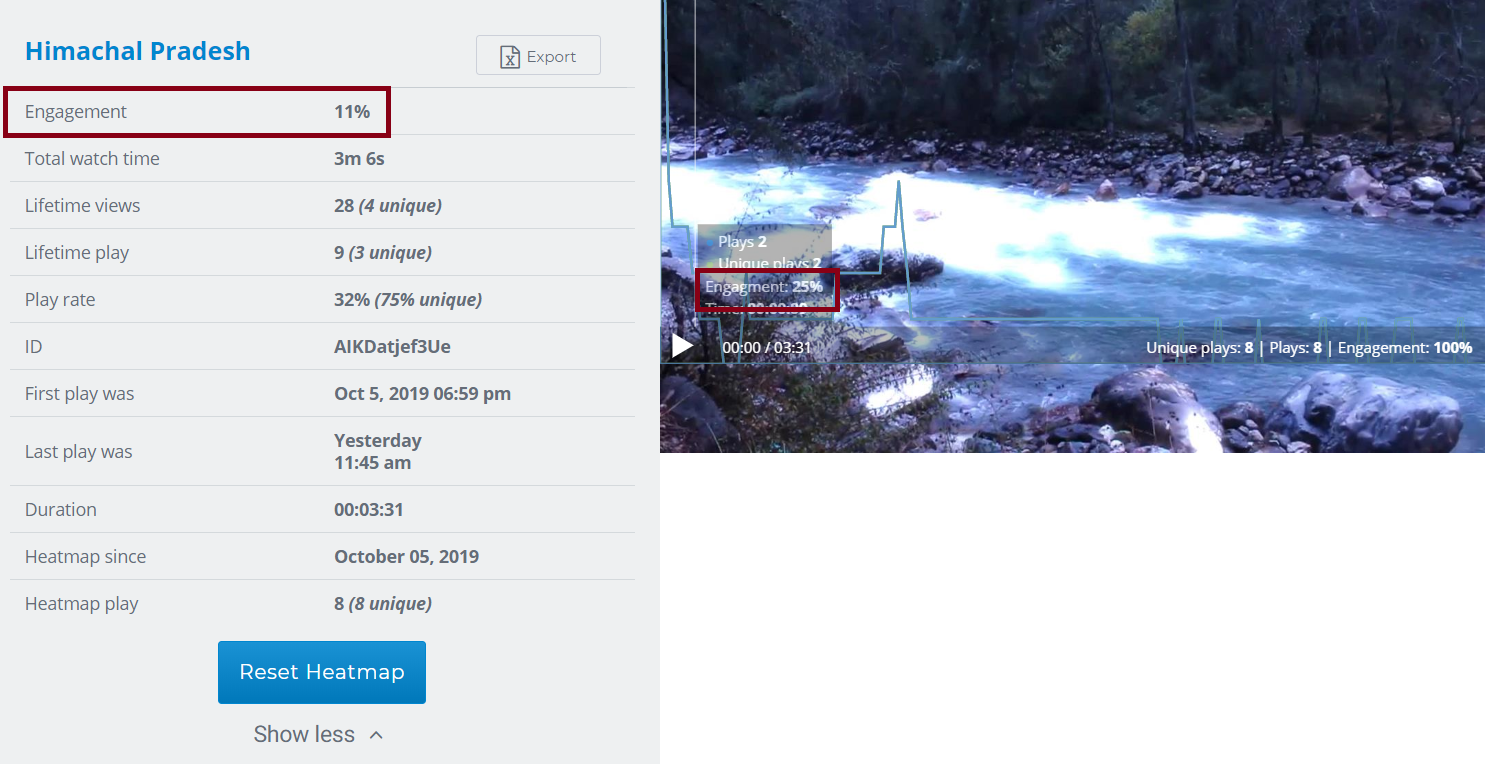
The key to accurately gauging video engagement is collecting the right kinds of data. Different video hosts provide a myriad of analytics metrics that you can then use to measure engagement on your videos.
Keep in mind that fewer people are likely to reach the 100% mark than reach the 25% mark. That’s completely normal, especially if your videos tend to be longer.
In other words, it’s nearly impossible to get 100% viewer retention. Don’t waste resources and times trying to pursue that target.
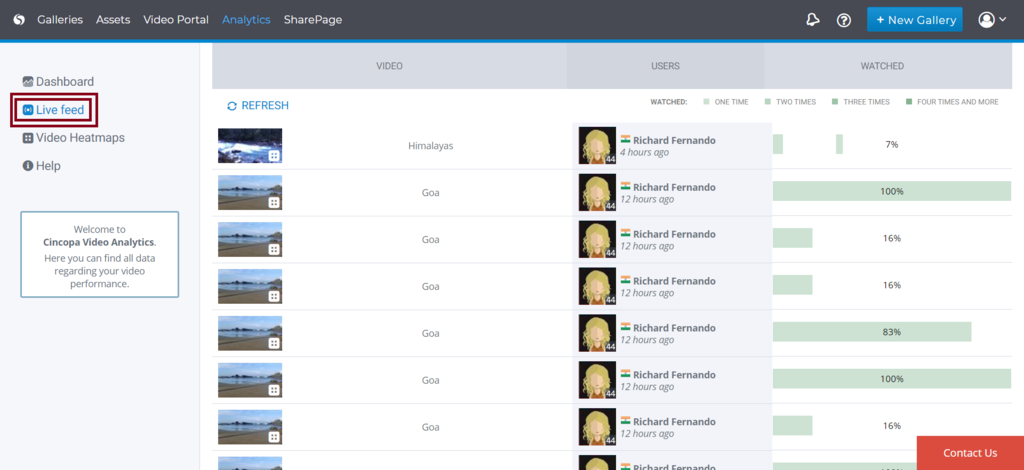
How to check User Engagement for a video?
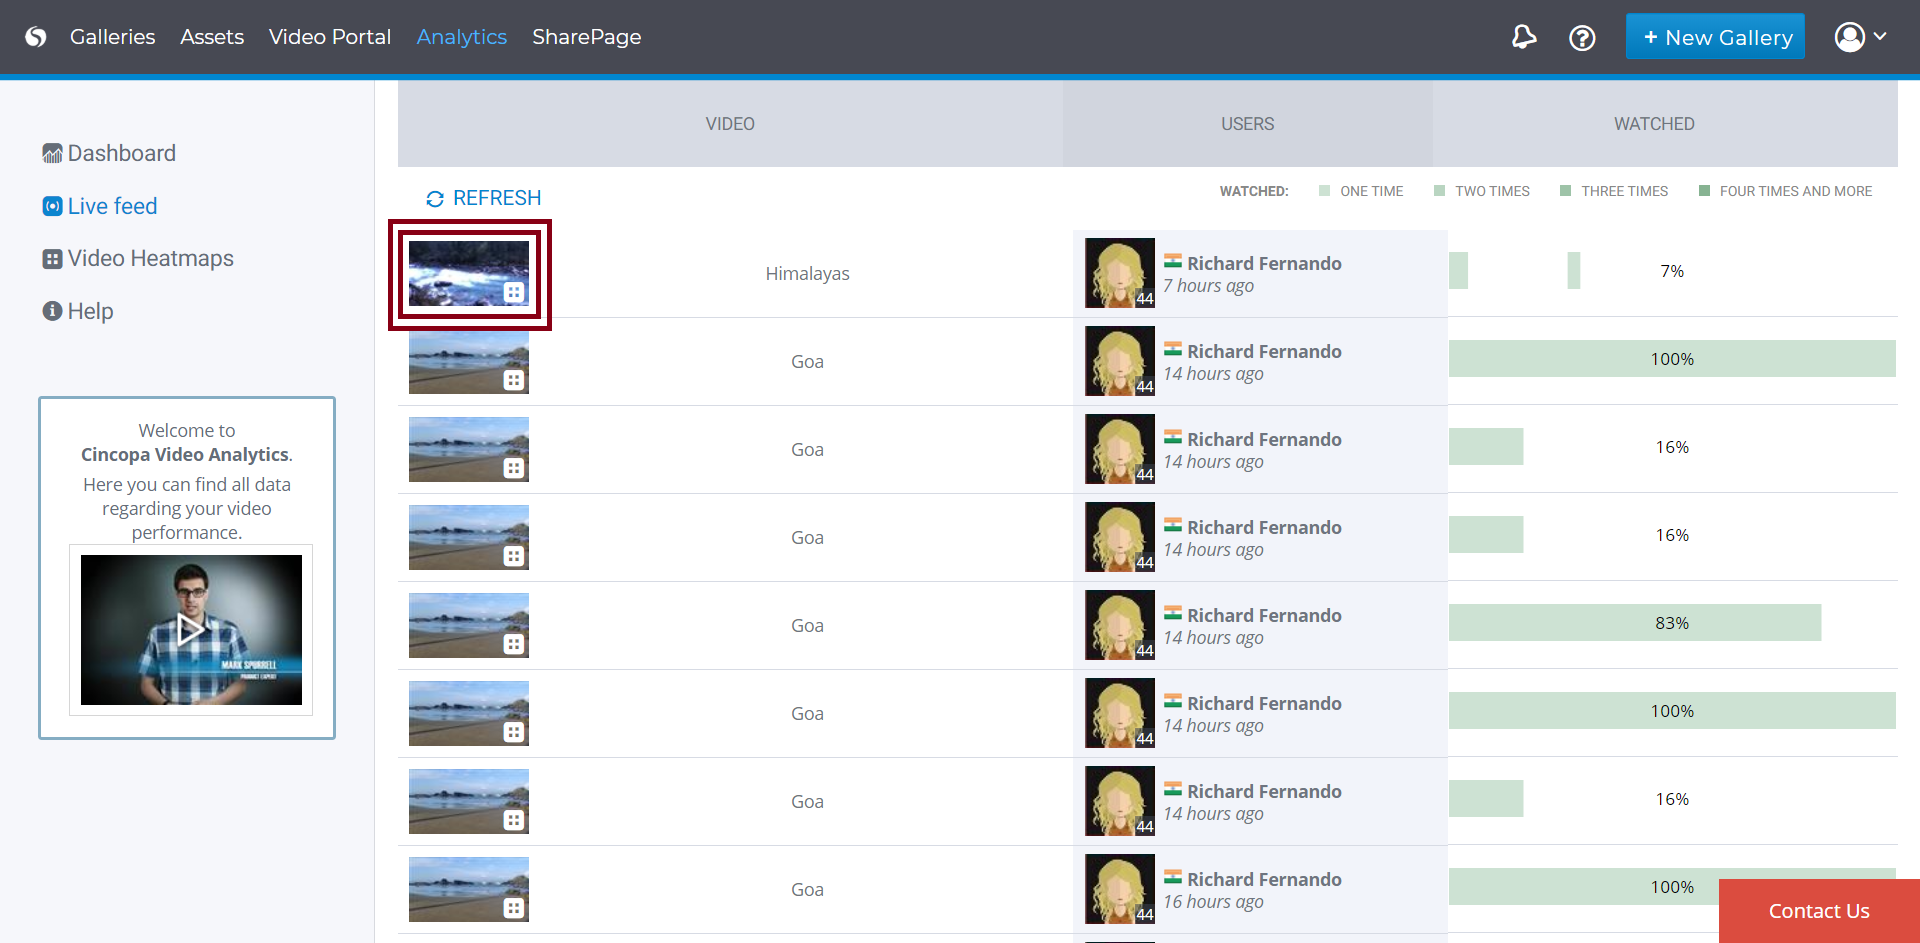
You can gather these analytical data and once compiled, you can then use this data to create a report for each video to better understand which videos have better retention rates.
It’s then possible to deduce which content and subjects are more engaging towards your target audience.
Better yet, if your videos are broken down into more specific categories, you can study each one of them individually and find out which content interests your users the most. If any ads appear at any point in the video, you can also use their completion rates to measure the effectiveness of your video.