
Boost Campaign Performance Through Video
Discover how to boost your next campaign by using video.
Download NowVideo analytics
Understand your video audience down to the individual viewer.
Measure engagement and key KPIs with actionable analytics and video heatmaps.
"Understanding how your audience interacts with video is the key milestone to successful marketing. With Cincopa’s Video Analytics, you can be sure that your videos not only look great but also deliver excellent marketing results."
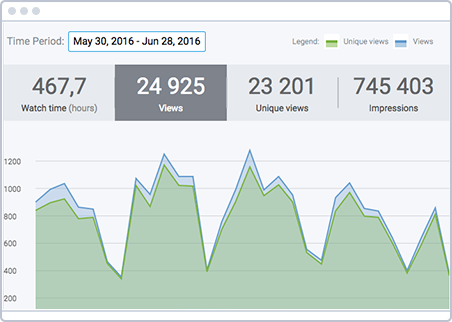
Dashboard
Cincopa Video Analytics dashboard shows aggregate video stats within a selected timeframe. For your convenience, data is presented in a graph, which is perfect to comprehend how video stats change in dynamics.
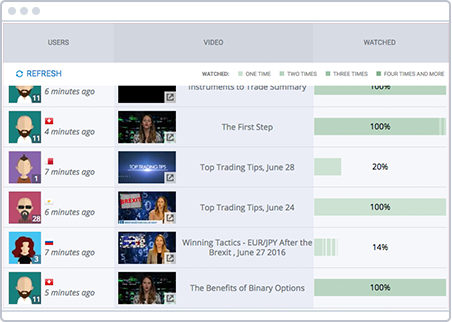
Live Feed
Cincopa Video Analytics Live Feed provides detailed information about each person who has watched the video, including a viewing heatmap and engagement rate. You can also access additional information such as the URL where the video was watched, device type, country, and if the viewer is identified through a form, email merge tags, or API, their name and email address.
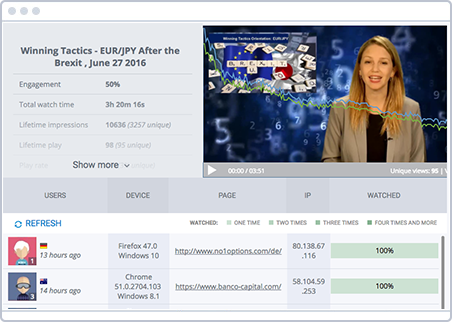
Video Heatmap
Video heatmaps provide valuable insights into your viewing patterns, revealing how your audience engages with your videos. They show you where drop-offs occur and help you optimize your content to serve your viewers better and drive business growth with more impactful content.
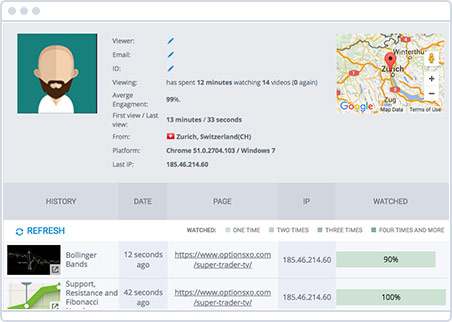
Video Viewers
The viewer's screen displays comprehensive information about each user, including their location, viewing time, average engagement, first and last view dates, platform, and IP address.