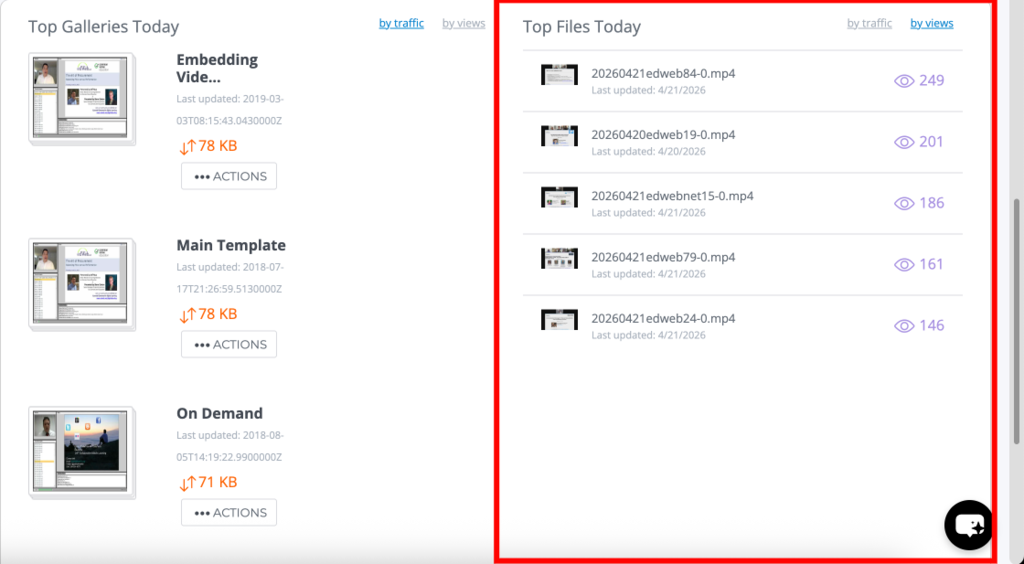
The Account Overview section provides a centralized view of your account details, resource usage, and activity insights. It allows you to monitor traffic consumption, storage utilization, API activity, and content performance from the dashboard.
This section is designed to give you a clear understanding of how your account is being used, helping you track performance, manage resources, and make informed decisions.
How to Access Account Overview
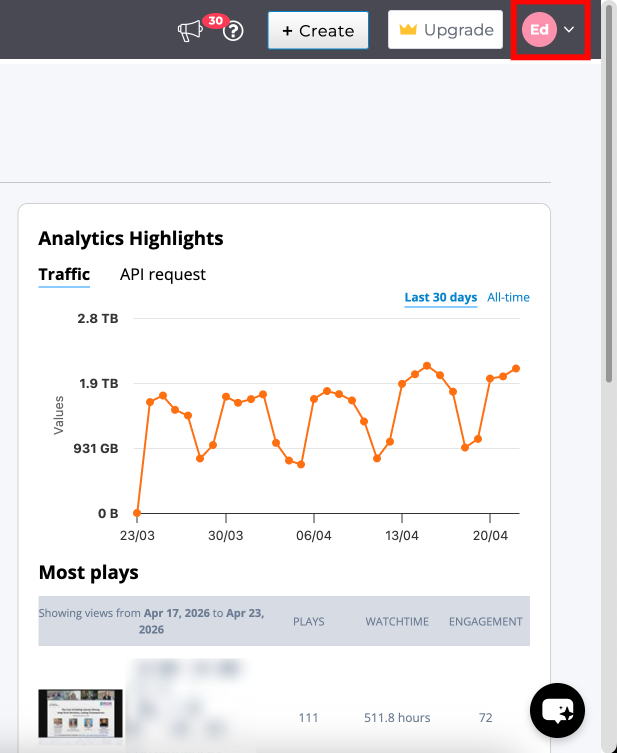
Step 1: From dashboard click your profile icon in the top-right corner
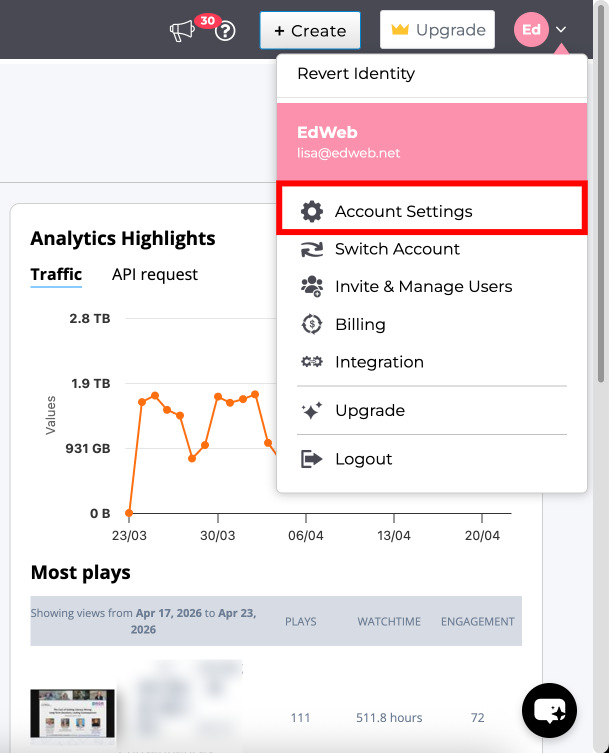
Step 2: Select Account Settings from dropdown menu
Step 3: The Overview page will open by default

Account Information
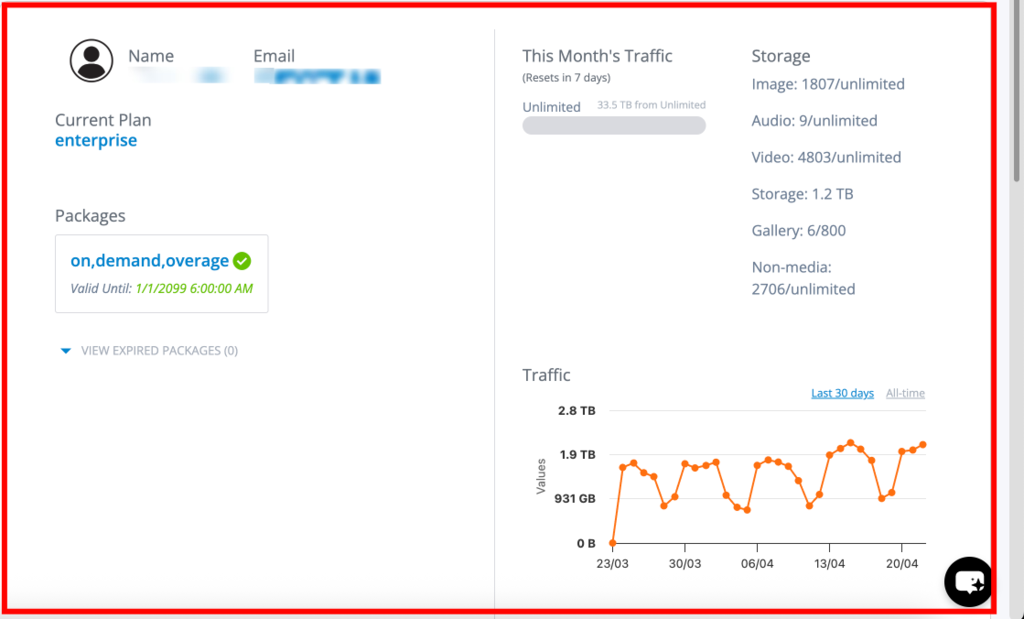
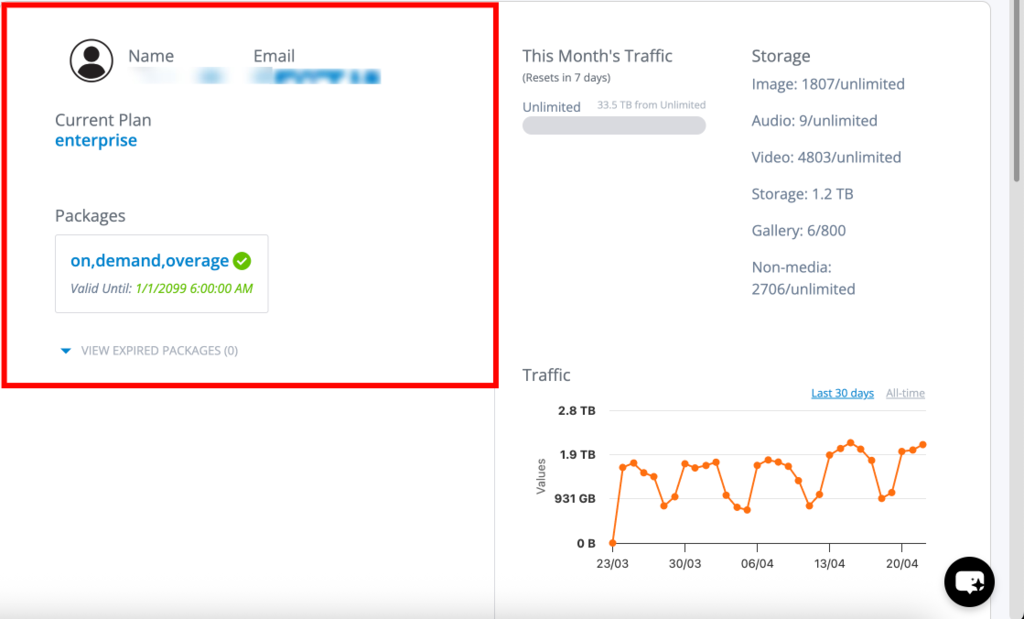
The Account Information section displays the core details associated with your account. This includes your account name, registered email address, current subscription plan, and any active packages linked to your account.
If your plan includes additional packages such as overage or add-ons, they will also appear here along with their validity. This section helps you quickly verify your account identity and subscription status.
Usage Overview (Traffic & Storage)
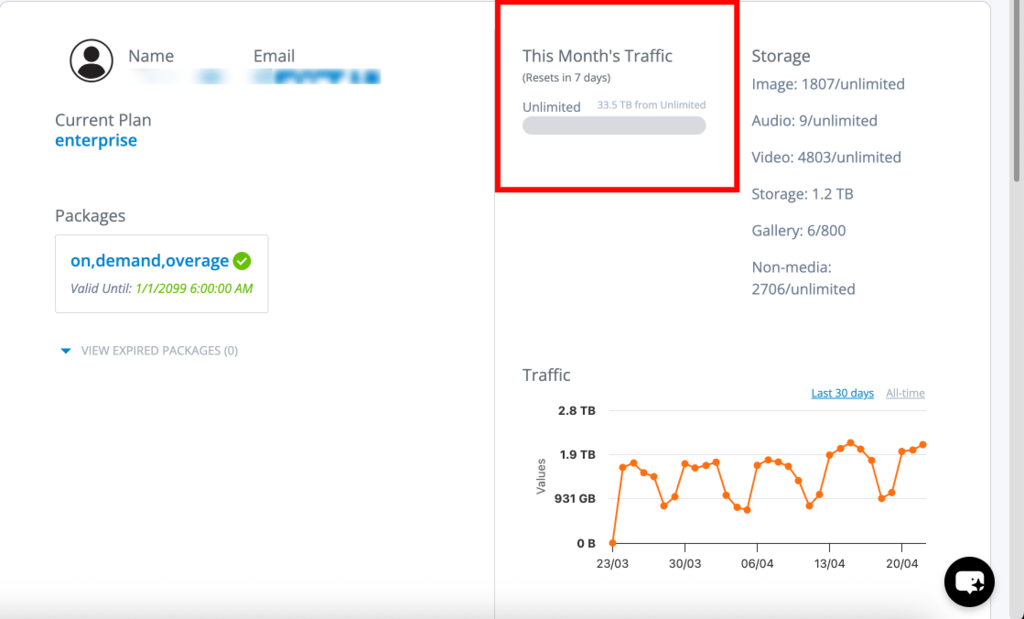
This section provides a combined view of your account’s resource consumption, including both bandwidth usage and storage allocation.
Traffic usage shows how much bandwidth has been consumed during the current billing cycle, along with the remaining quota and reset timeline. This helps you monitor delivery usage and plan accordingly.
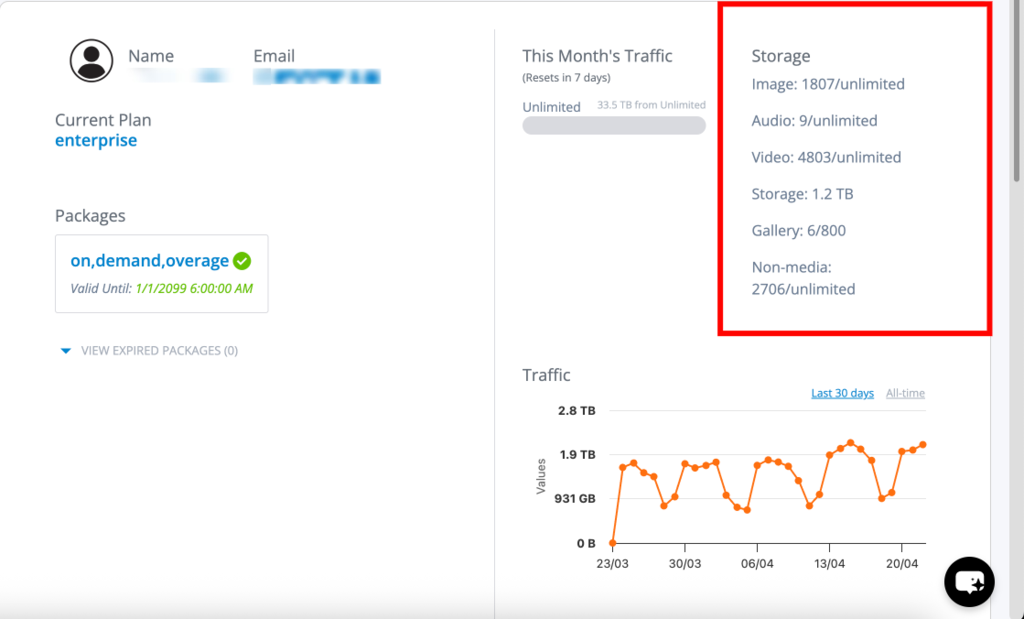
Storage usage displays how your account storage is distributed across different media types such as images, videos, audio files, galleries, and other assets. Each category reflects current usage against your plan limits, giving you clear visibility into available capacity.
Together, these metrics help you manage your account efficiently and avoid unexpected limits.
Analytics (Traffic & API Requests)
The Analytics section provides visual insights into your account activity over time.
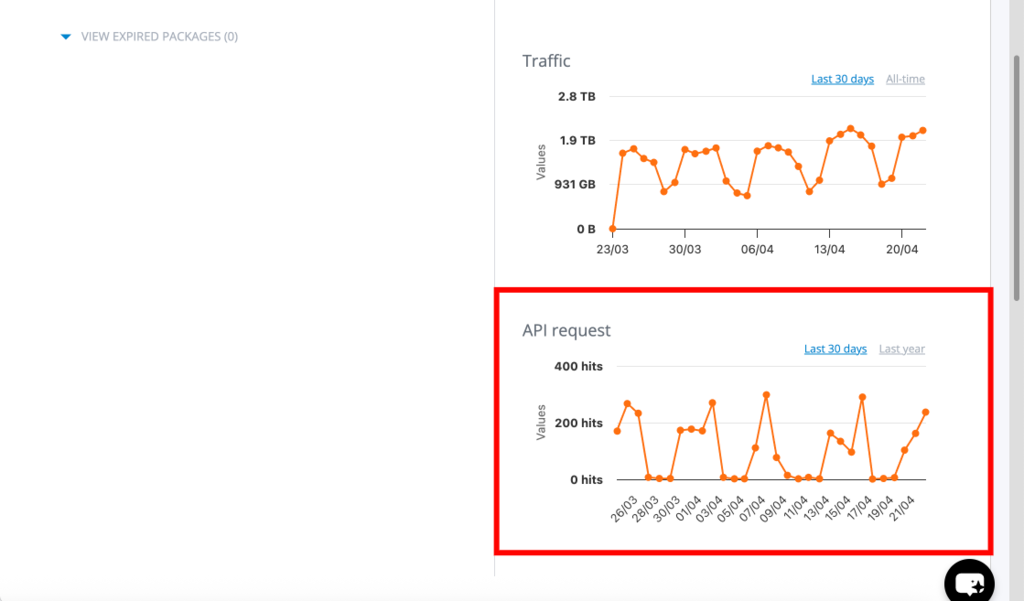
The traffic graph shows how bandwidth usage changes over time, helping you identify trends, spikes, or drops in activity. You can adjust the time range to analyze recent usage or long-term patterns.
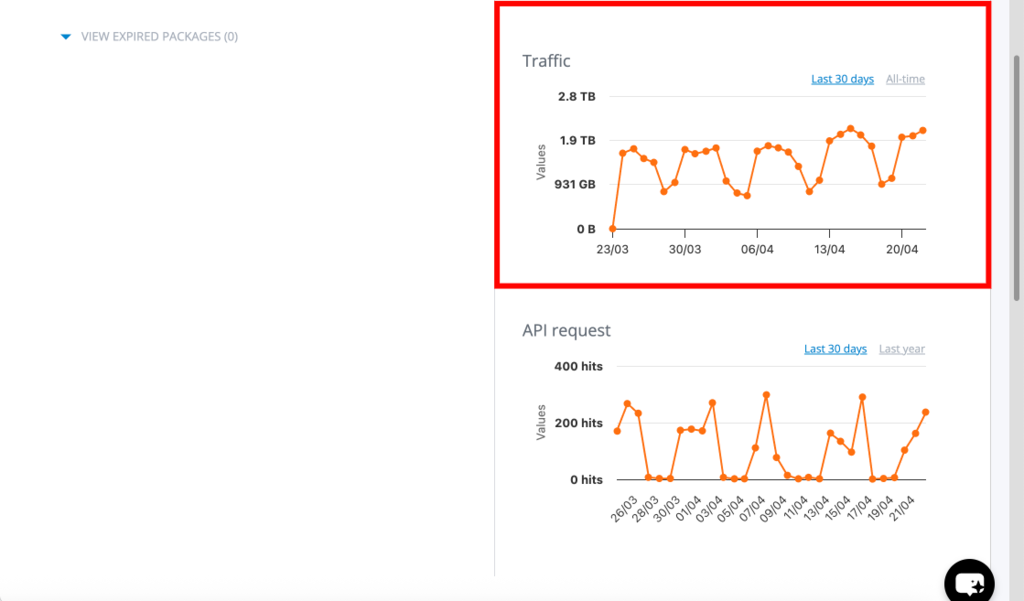
The API requests graph displays the number of API calls made to your account. This reflects how frequently your account interacts with integrations, external systems, or automated workflows. Monitoring this helps ensure your integrations are functioning correctly and efficiently.
Top Galleries
The Top Galleries section highlights the best-performing galleries based on activity such as views or traffic.
This allows you to quickly identify which galleries are generating the most engagement. It is useful for evaluating content performance and understanding what type of media is resonating with your audience.
Top Files
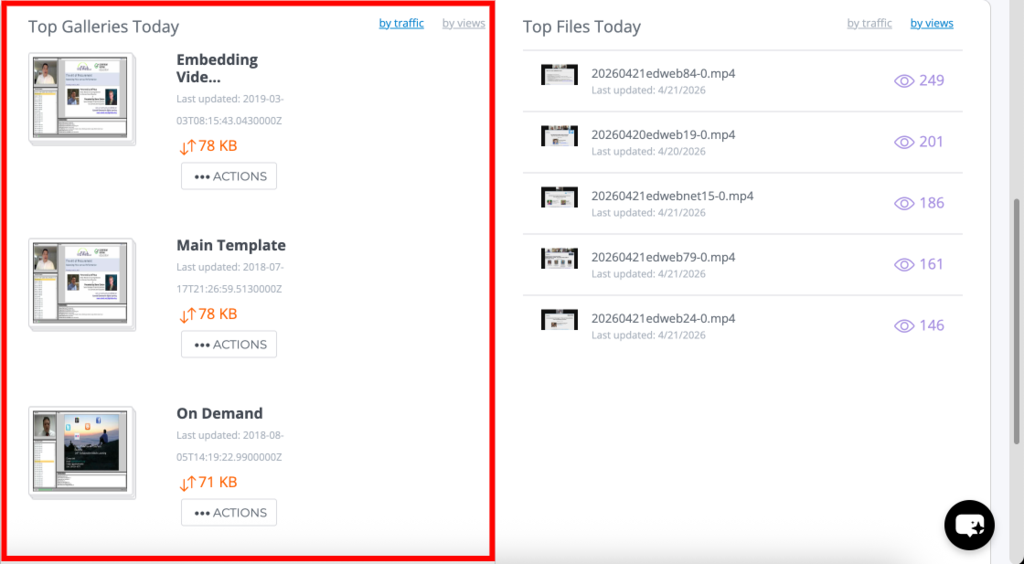
The Top Files section displays individual media files that are receiving the highest engagement.
These files are typically ranked based on views, helping you identify top-performing content at a more detailed level. This insight can be used to optimize your media strategy and focus on high-impact content.