This article explains how you can access analytics for your assets.
Cincopa has powerful video analytics tools that allow the user to track the viewer’s engagement with content in order to differentiate between curious viewers and potential leads.
On video analytics, you can see where video views came from, how your audience interacted with the video content, and view detailed statistics for each video asset.
On a video hosting platform like Cincopa, every video view generates a video heatmap that shows a second-by-second breakdown of the viewer’s engagement on the video asset.
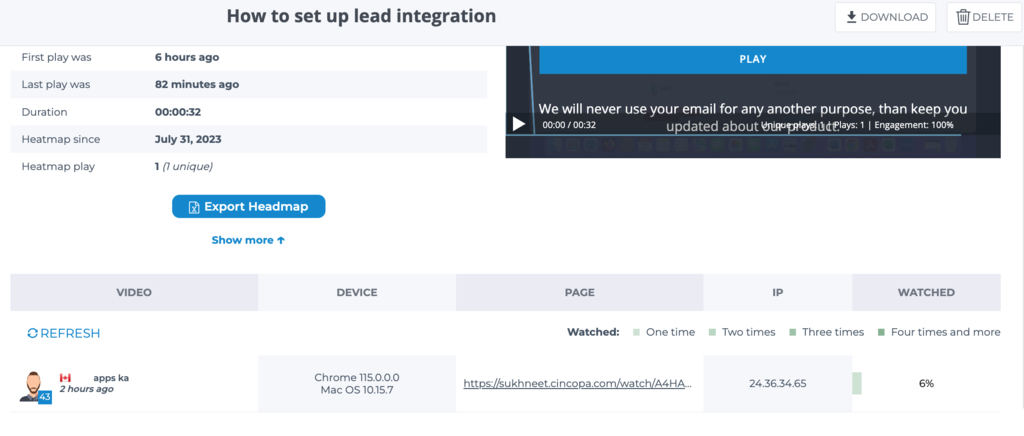
The video heatmap contains unique viewer information, and contextual information such as where and when the video was watched. We have also included a color-coded timeline on Cincopa’s video heatmap showing the viewers interaction with the video.
Steps for accessing the Video Analytics:
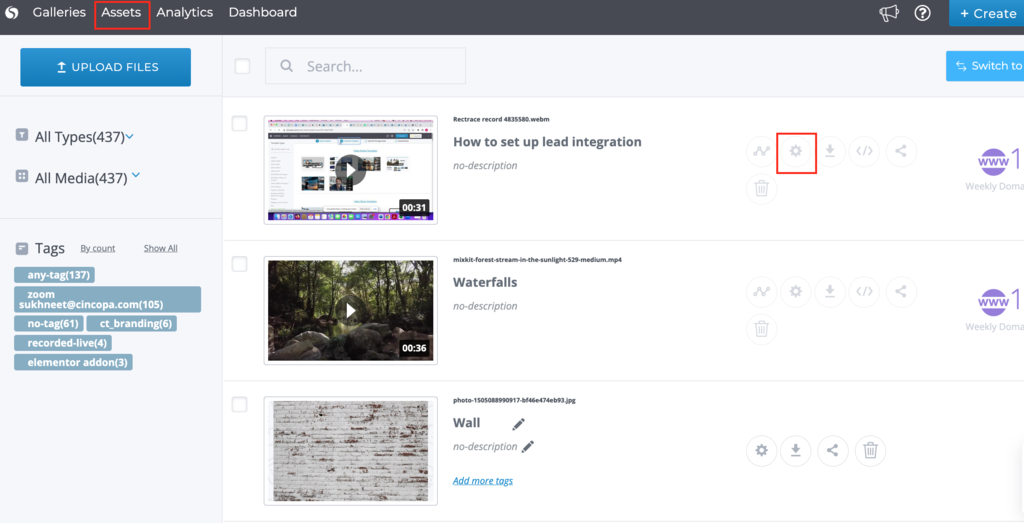
- Open the asset settings by clicking on the Settings icon on the Assets page.

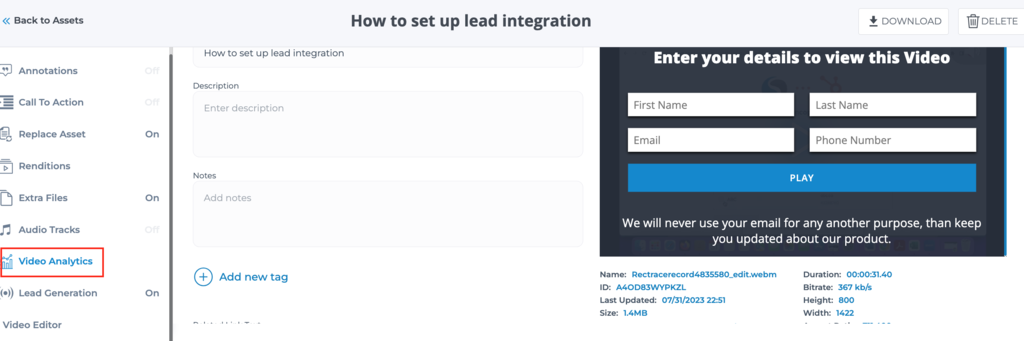
- Click on Video Analytics from the left hand side modules list.
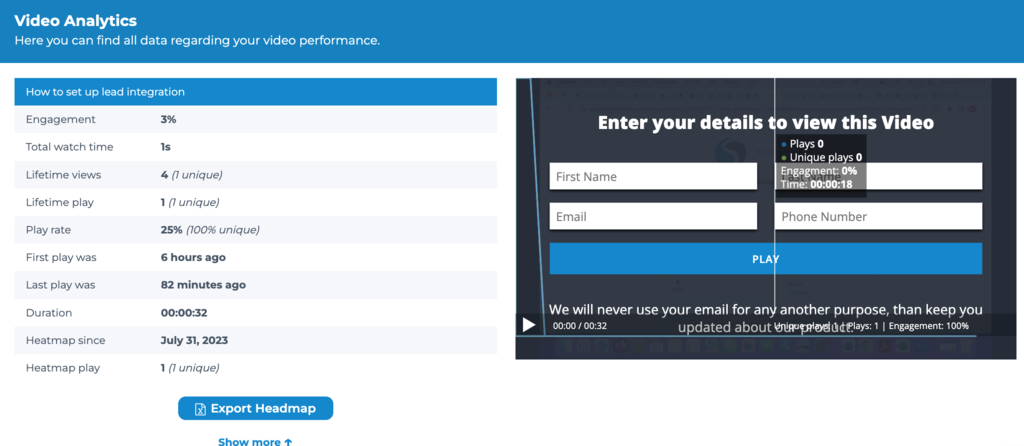
- It shows the video heatmap which can also be exported to excel.