Cincopa has powerful video analytics tools that allow the user to track the viewer’s engagement with content in order to differentiate between curious viewers and potential leads.
On video analytics, you can see where video views came from, how your audience interacted with the video content, and view detailed statistics for each video asset.
On a video hosting platform like Cincopa, every video view generates a video heatmap that shows a second-by-second breakdown of the viewer’s engagement on the video asset.
The video heatmap contains unique viewer information, and contextual information such as where and when the video was watched. We have also included a color-coded timeline on Cincopa’s video heatmap showing the viewers interaction with the video.
The Cincopa ‘Video Analytics’ dashboard shows aggregate video stats within a selected timeframe. For your convenience, the video analytics data is presented in a graph and can be exported for use in other programs or archived for later use.
Lets get Started – Here is the step-by-step process to check detailed video analytics on published video assets
1. Log into your Cincopa Account or Sign up for a new Cincopa Account
2. Create a Cincopa Video Asset Gallery
3. The Best practices for sharing your video galleries with Customers, Leads, and team-members are as follows:
- Embed Your Galleries into Your Email Campaigns
- Share your galleries via URL
- Gallery Embed VS Asset Embed
Now that your galleries and files are shared or embedded, Cincopa’s Video Analytics start gathering information on your viewers watching the videos.
Understanding how your audience interacts with your video content is a key-component to successful enterprise and marketing strategy.
With Cincopa’s new Video Analytics, you can be sure that your videos not only look great but also deliver excellent results.
Video Analytics for Assets- How to check the video view count?
In the menu on the top left hand corner of your profile screen, select Assets.
Each asset including videos and images, has it’s own analytics display available to the right of the thumbnail and settings options.
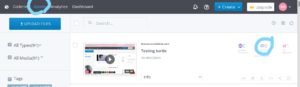
The View Icon will show you how many times the file was viewed within the last week.
Note: when you are testing your files its counted as view as well
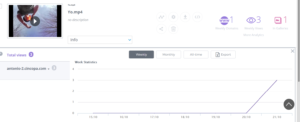
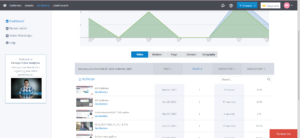
Selecting the More Analytics option will open a graphic presentation of views over a timeline.
You will have the ability to see a viewer count and which link the viewers used to engage with the content.
You will also be able to change displayed time periods from weekly to Monthly or All-time and to export the results.
Note: exporting video analytics results available for only the Corporate plan and above.
Video Analytics for Galleries- How to check my Gallery views?
Using the menu in the upper left hand corner of your Cincopa Profile, select the Galleries option.
From here you can scroll down to navigate though a list of your galleries, you can also use the gallery sorting features with gallery tags and gallery metatags to help narrow down your selection.
Each video gallery will have its own set of analytical information available for your viewing.
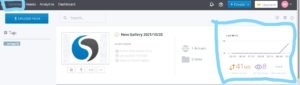
Each Gallery will have a customizable thumbnail preview on the left hand side of the screen and basic analytical information for the gallery will be listed to the right of that.
This basic gallery analytics information will display today’s traffic, weekly views and an option to expand on the basic analytics.
Advanced analytical information will be available under the main analytics tab that can be accessed via the ‘Analytics’ button in the upper left hand corner of your Cincopa profile.
Note: when you are testing and previewing your gallery, these are counted as views.
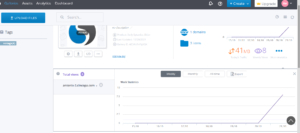
Selecting more analytics, the link will open a graphic presentation of views over a timeline.
In more analytics you will be able to see what day you had more viewers and which link was engaged. You will be able to change displayed time periods from weekly to monthly or all-time and to export the results.
Note: exporting analytics result available only for a Corporate plan and above.
Video Analytics & Video Heatmaps – Get to know your audience?
Select the Analytics option from the menu in the upper left hand corner of your Cincopa Profile.
This will take you to the analytics dashboard.
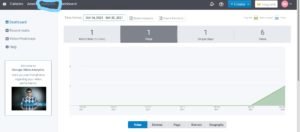
Analytics Dashboard
Cincopa Video Analytics dashboard shows aggregate video statistics within a selected timeframe.
For your convenience, data is presented as a graph.
For more information please follow this link to our Video Analytics Dashboard article
Recent Visits
The recent visit page provides you with information regarding your viewer’s most recent interactions with your video content.
Heatmaps
Video heatmaps provide a practical way to differentiate between viewers who are interested and those who are not.
On a video hosting platform like Cincopa, every video view generates a video heatmap that shows a second-by-second breakdown of the viewer’s behavior.
Common Questions about Video Analytics
Question 1: I would like to be able to see how many views each episode of my podcast gets so I can learn which videos are the most popular and gauge how much I can charge for sponsorships.
How do I acquire this information?
Answer: When you log in to your Cincopa profile, you will have the ability to navigate to the ‘Analytics’ area as displayed in the screenshots below. This will display general information such as view count, average watch length, and viewer engagement percentage. You can take this a step further and select the ‘See Heatmap’ option as displayed in the second screenshot and this will provide you with in-depth analytical data specific to the selected video.
Question 2: Cincopa video analytics shows that my video has been played on my homepage (www.example.edu).
However, I do not have that gallery/video on that page….so not sure how to interpret.
Answer: In rare cases, the full URL is not available because it is blocked either by the CMS/LMS or by the embed code when using iframe.
In those cases, Cincopa video analytics just shows the domain itself.