This article explains how you can export analytics data into a CSV file and view the engagement data summarized by asset, page, domain, device and geography.
Steps for exporting the engagement data:
- Click on the Analytics option from the top-left menu once you are logged in to your account.

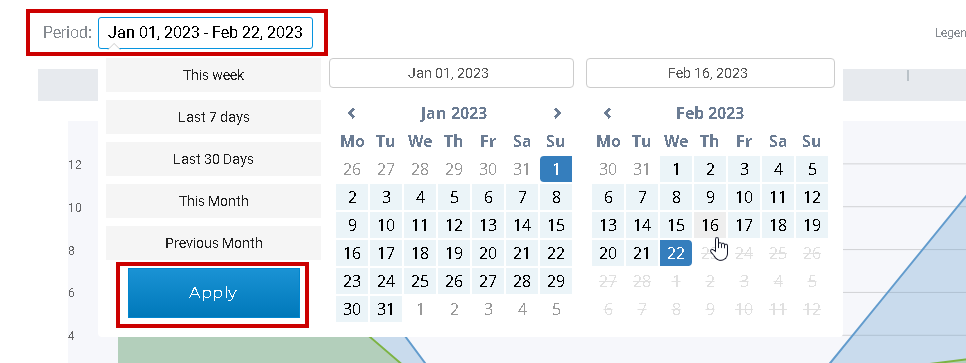
- Click on the Period field to select the date range you would like to export the data for and click on Apply.

- Click on the Download option from the right hand side and then click on Export Analytics to export the analytics data into a CSV file.

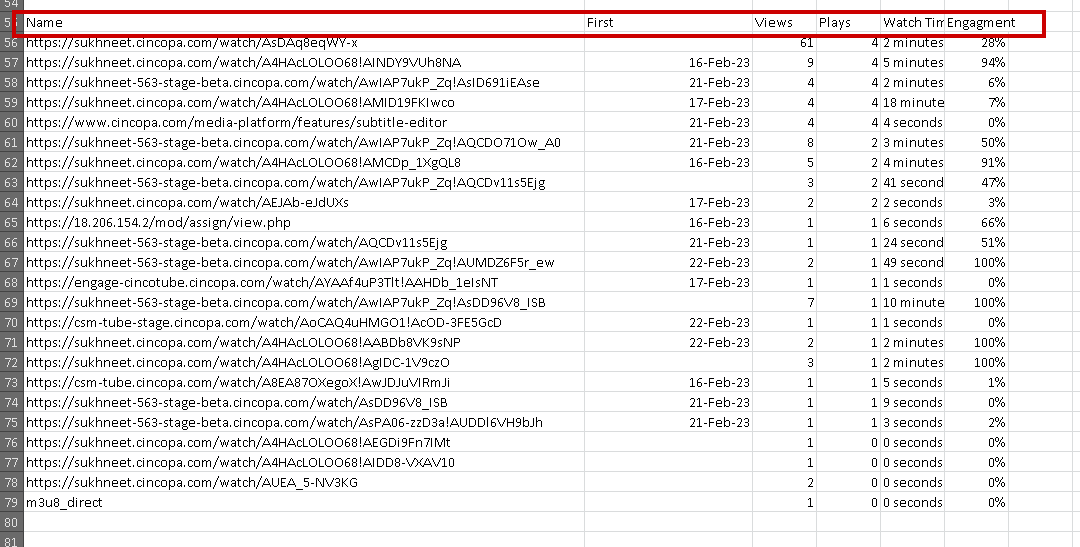
- In the excel file, you will see different sections that summarize the analytics data by video, device, page, domain and geography. It shows the number of views, plays, watch time as well as what was the engagement.

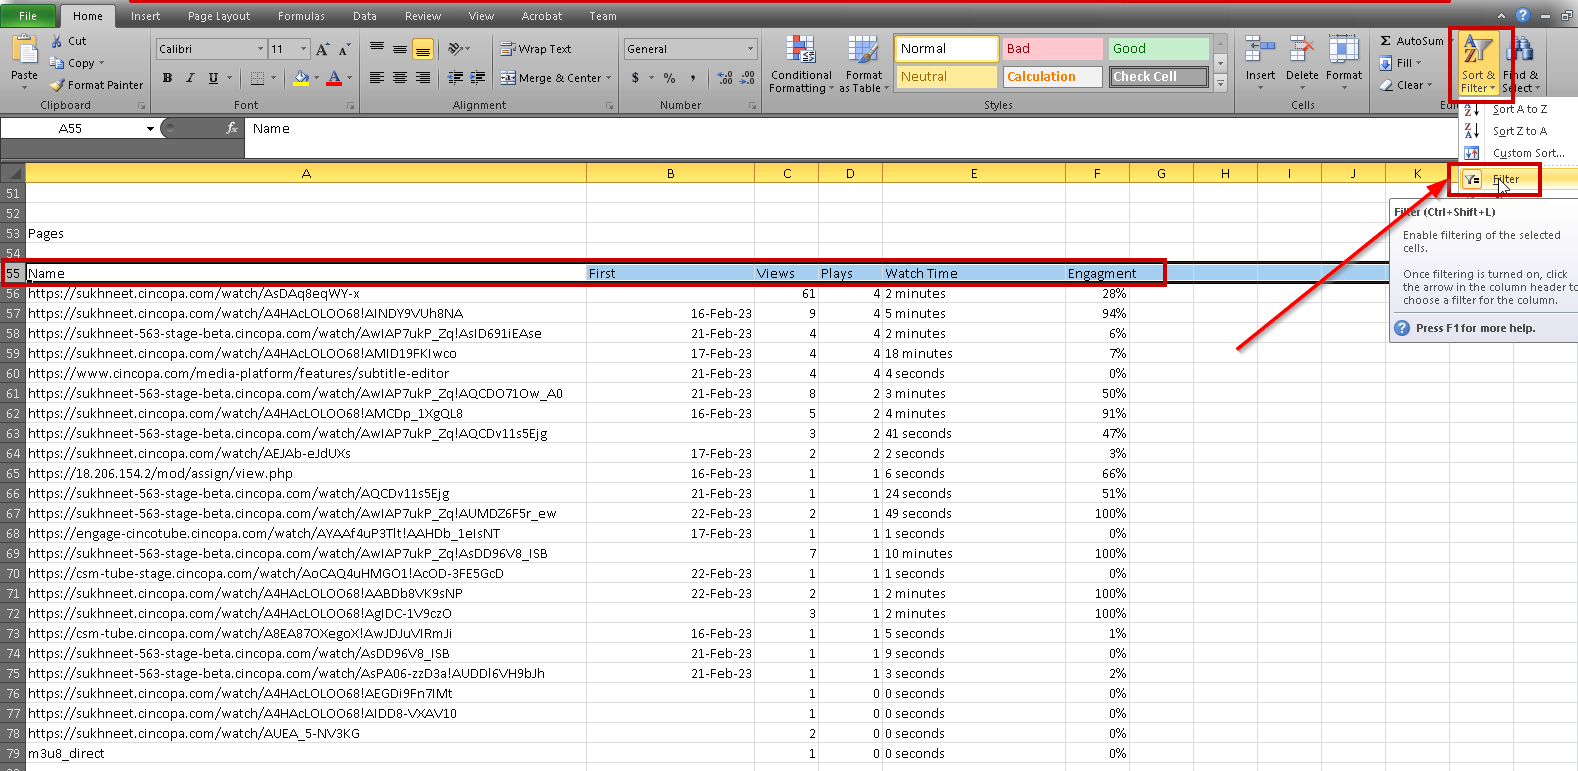
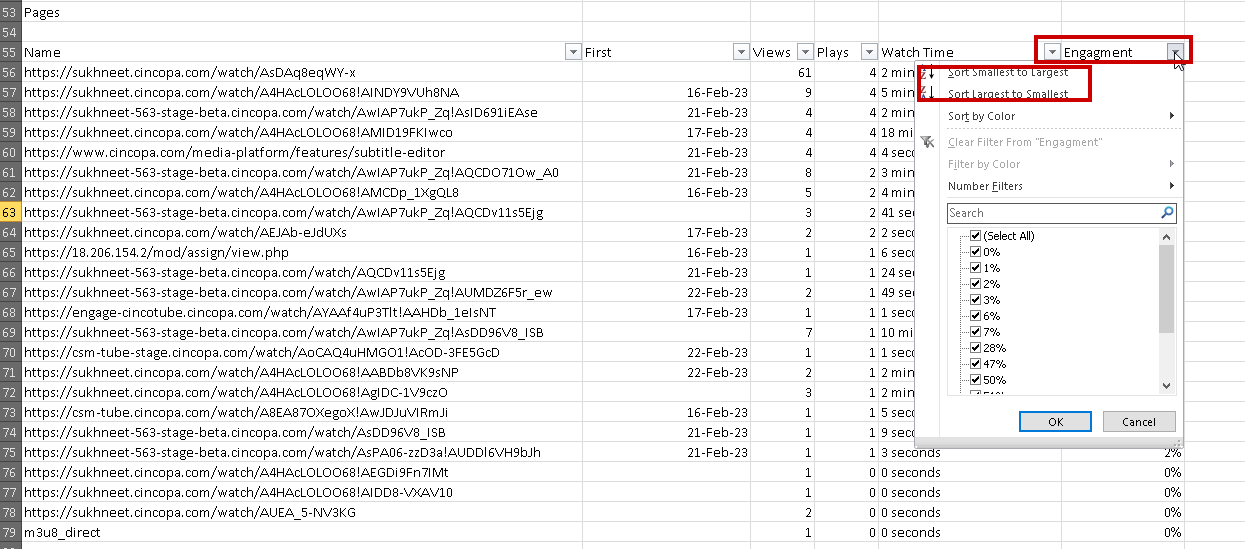
- In excel, you can select the row on which you would like to apply the filter and then sort the data based on the number of views or engagement. In the example below, there is a filter set up on the pages. This shows you the summary for all pages for the selected time period.


The screenshot below shows you the data for each video. You can then set up a filter and sort the list by number of plays or engagement.


