Cincopa also allows users to track their galleries with Images and Slideshow analytics data by allowing them to integrate with their Google Analytics account.
Getting Started
To get started, users need to have media in their Cincopa account and also an active Google Analytics account. You can create an account from this URL: https://analytics.google.com.
It is important for you to add the Google Analytics Tracking Code to your website before you enable Google Analytics with Cincopa and track the Cincopa media activities.
You can go through this Google Article for more information on website integration: https://support.google.com/analytics/topic/1726910?hl=en&ref_topic=3544906
Why Google Analytics Integration?
Google Analytics is a web analytics service offered by Google that tracks and reports website traffic. When Integrated with your Cincopa Image and Slideshow Gallery, users get Google Analytical data allowing them to see the user activities in your images.
How to integrate Google Analytics with your Cincopa Image and Slideshow Gallery?
Follow these steps to integrate Google Analytics with your Cincopa Image and Slideshow Gallery:
1. Log in to your Cincopa Account>>Select Galleries>>Click on Customize Template icon under a gallery you have created.
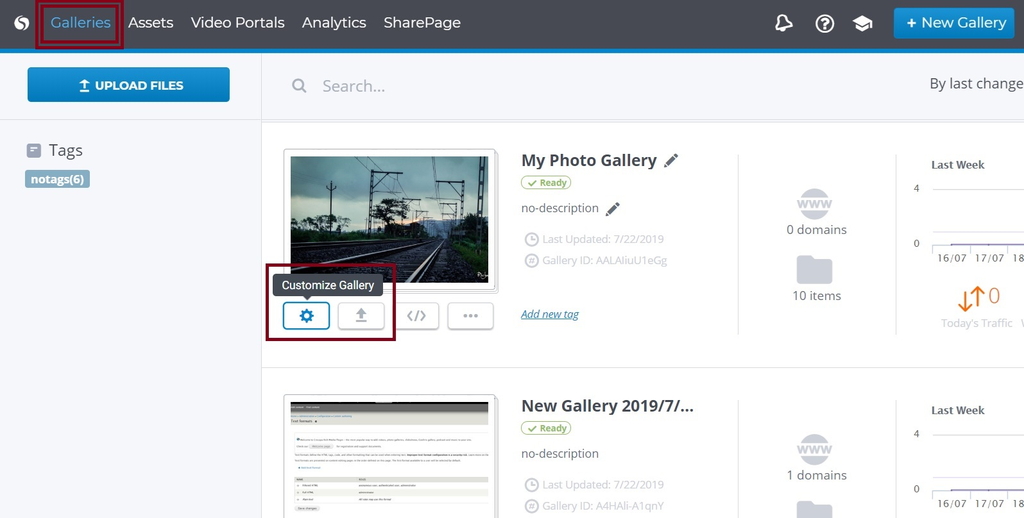
2. If you have no Gallery, then create one by clicking on New Gallery and upload your images in the gallery.
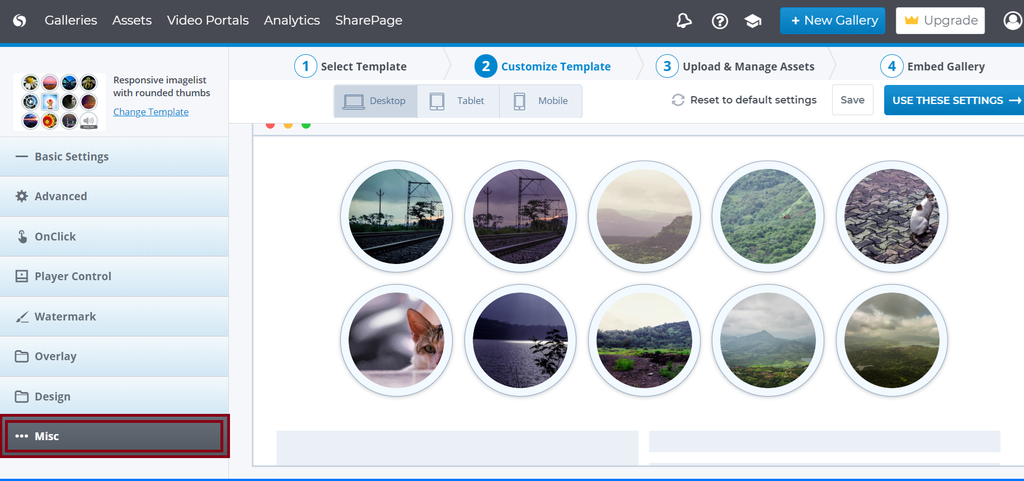
3. Now click on Misc
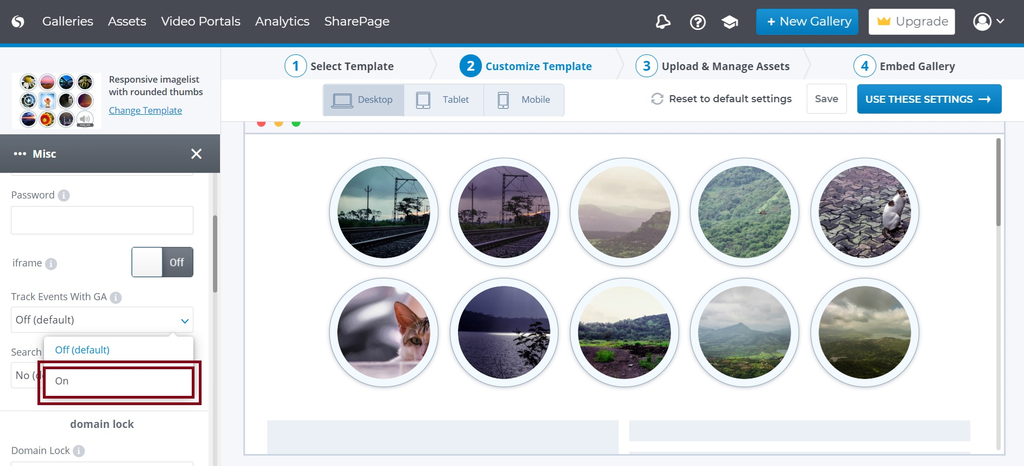
4. Under Misc >> Search for Track Events with GA and Enable it
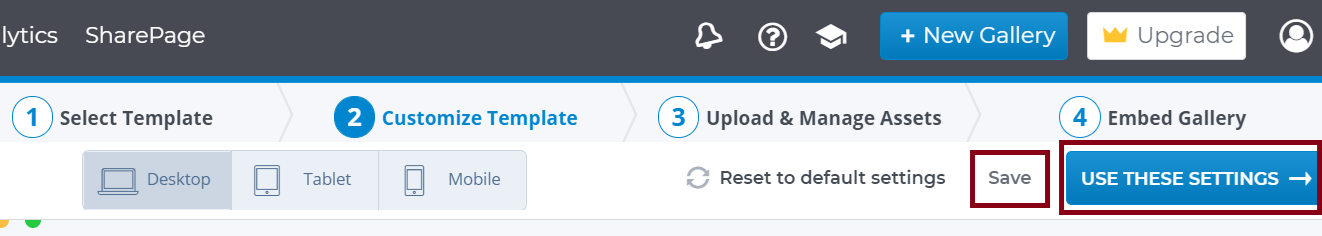
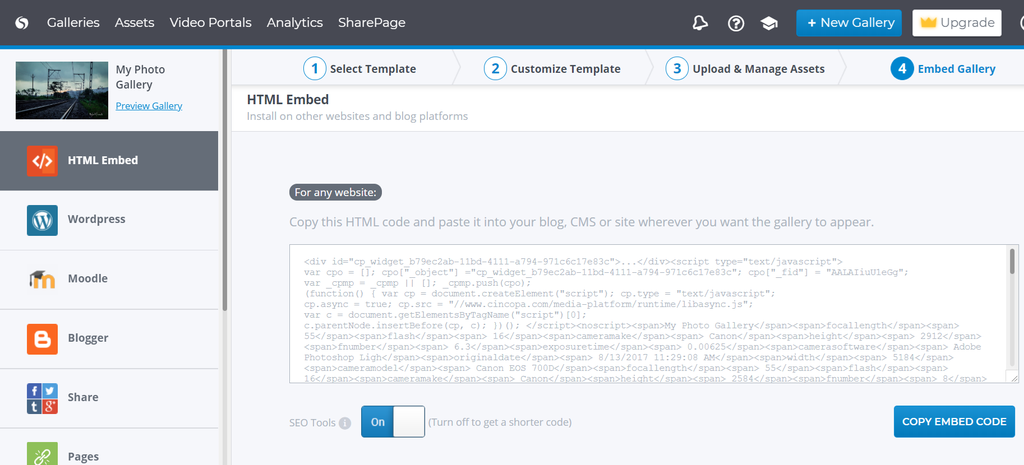
5. Save the changes and click on USE THESE SETTINGS to continue till you reach the Embed Gallery section.
6. Now click on Copy Embed Code to copy the HTML code that you can paste in your website.

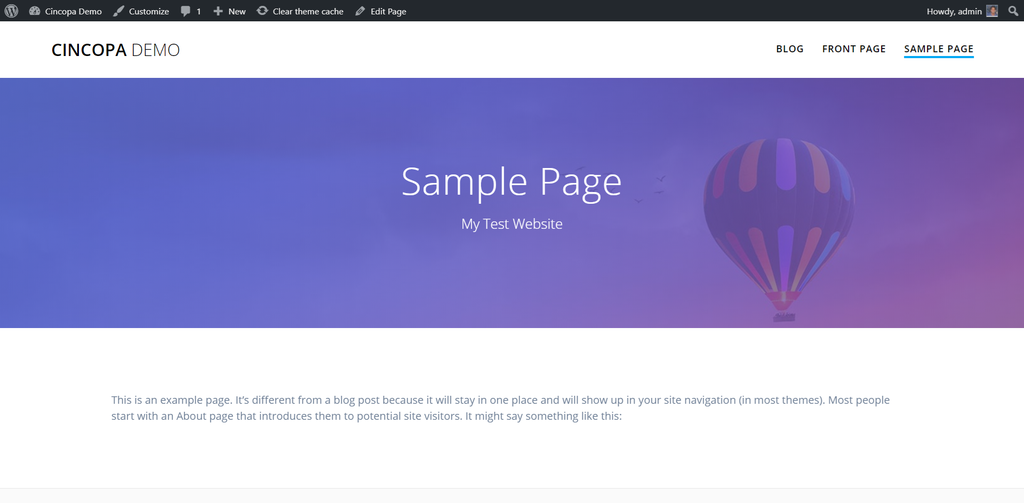
7. In this demo, we will add this HTML code to a WordPress sample page.
8. Please make sure that you have already added Google Analytics in your website before adding this code.
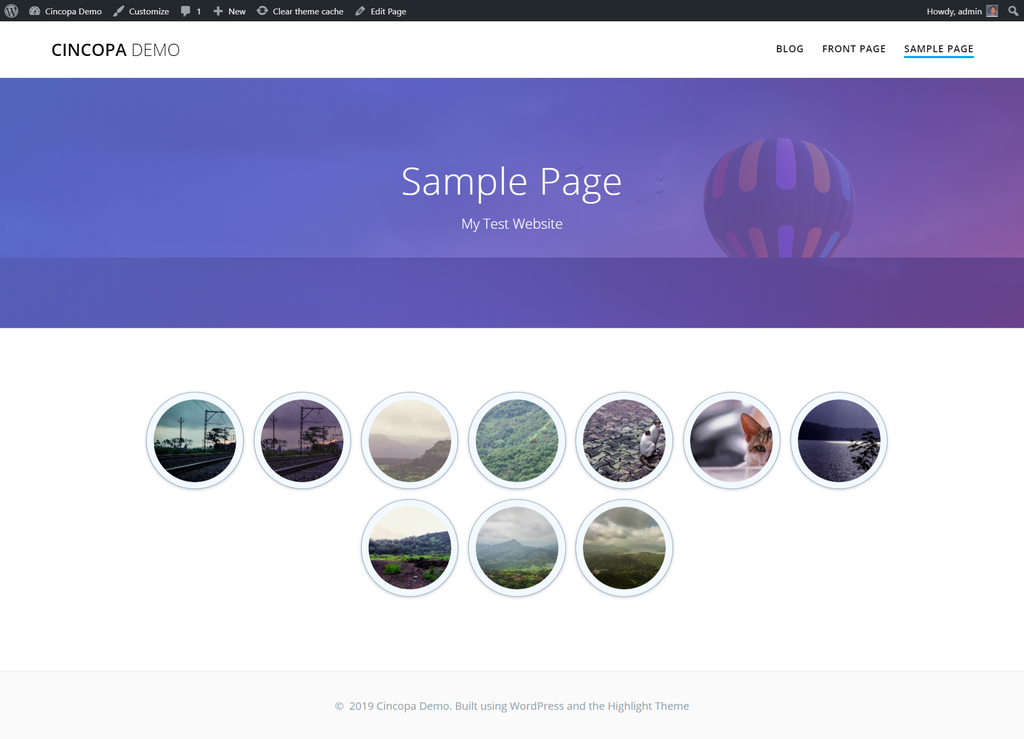
9. We will now add the copied HTML code to this sample page and save the changes.
10. Now if we try to access this page, it should display our Image Gallery.
How to check the user activity data for your Cincopa Video Gallery using Google Analytics?
Once you have an active Google Analytics Tracking Code added to your website and added a Gallery with Google Analytics Enabled, you can follow these steps to check the user activity data:
1. Login and access to your Google Analytics Account: https://analytics.google.com/
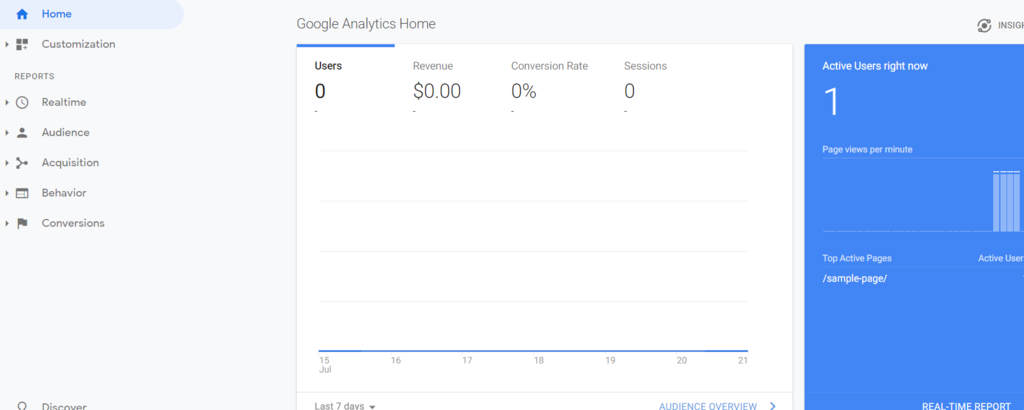
2. Click on Realtime >> Events >> Cincopa Galleries
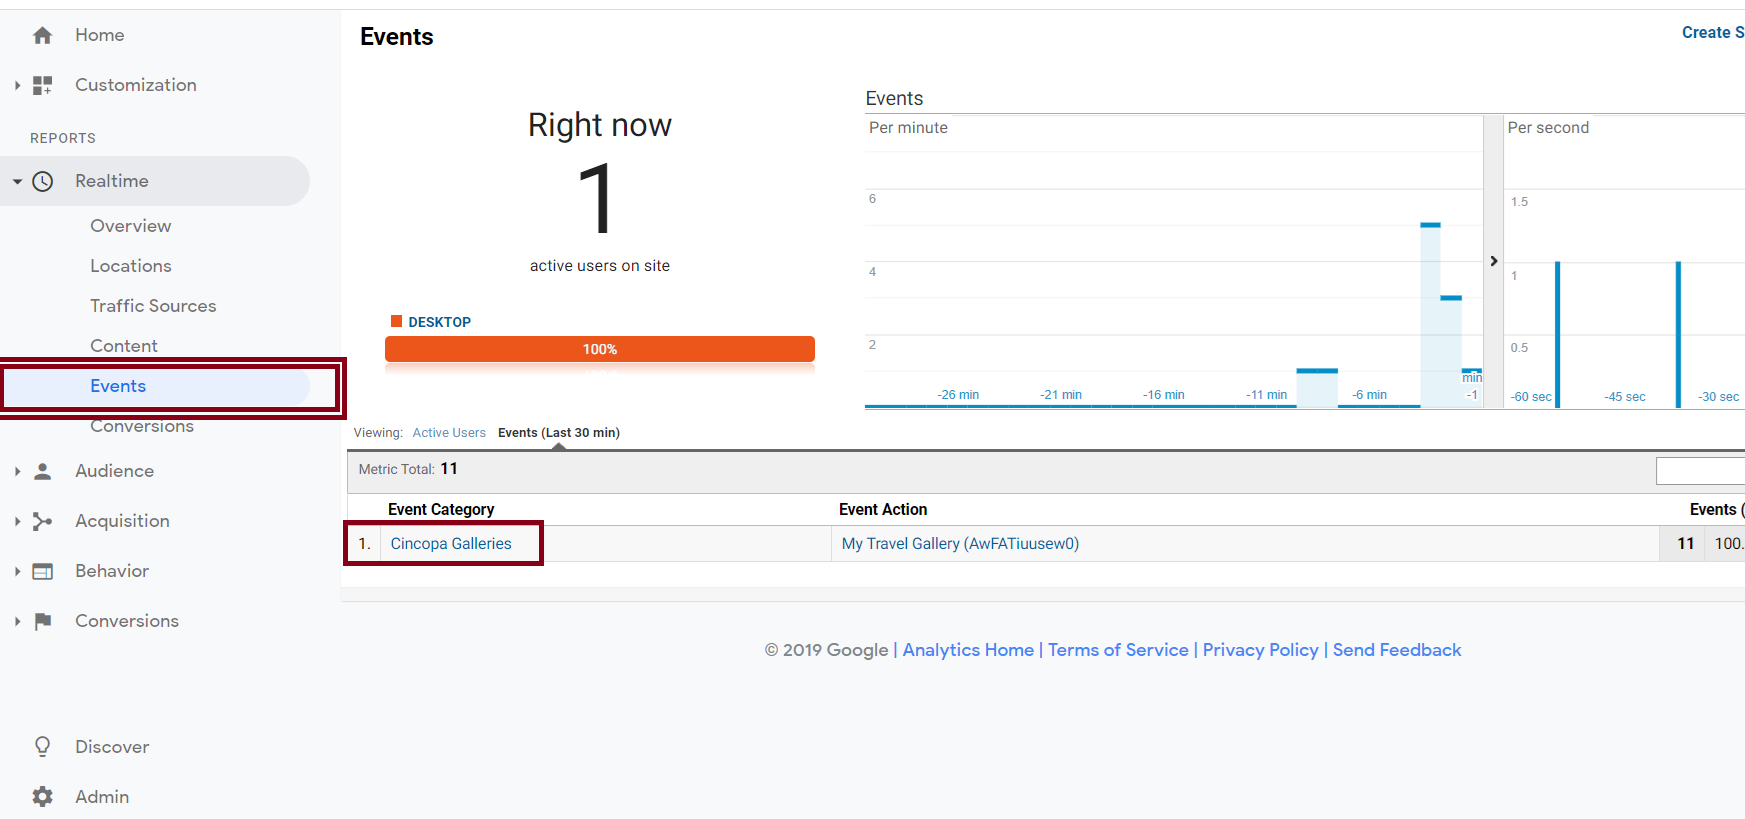
3. Here you can view all the activities
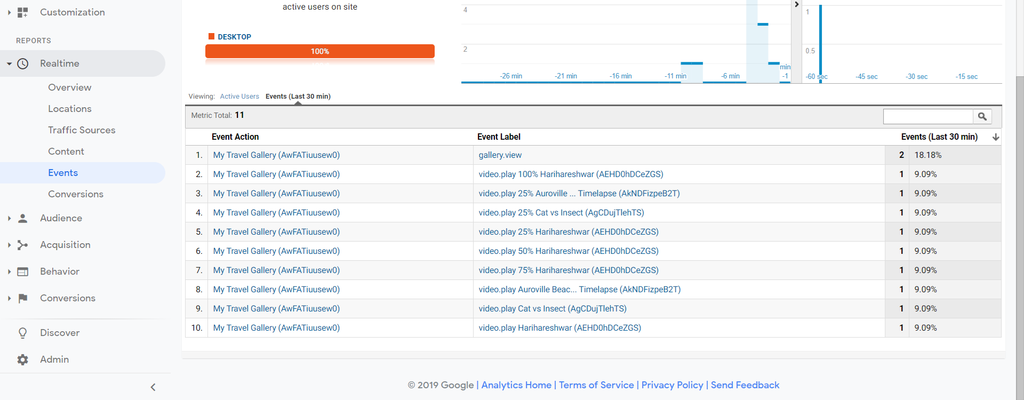
What Events are fired with Google Analytics Integration?
Please find below the list of Cincopa events that are fired while your Cincopa media is been accessed:
| Event | Description |
| gallery.view | Fires when user viewed the gallery |
| video.play {video_title}({video_id}) | Fires when video starts |
| video.play 25% {video_title}({video_id}) | Fires when video played 25% |
| video.play 50% {video_title}({video_id}) | Fires when video played 50% |
| video.play 75% {video_title}({video_id}) | Fires when video played 75% |
| video.play 100% {video_title}({video_id}) | Fires when video ends |
| audio.play {audio_title}({audio_id}) | Fires when audio starts |
| audio.play 25% {audio_title}({audio_id}) | Fires when audio played 25% |
| audio.play 50% {audio_title}({audio_id}) | Fires when audio played 50% |
| audio.play 75% {audio_title}({audio_id}) | Fires when audio played 75% |
| audio.play 100% {audio_title}({audio_id}) | Fires when audio ends |