Cincopa provides an API where you can attach a Heatmap to a video using an iframe. An iFrame is a HTML page integrated inside another HTML page. iFrames are usually used for showing advertisements, videos, or any content that you wish to show from another source URL.
If you want to attract high-quality leads and improve conversion rates, using video can help you more than other marketing methods.
However, Video has to be used strategically to be of real benefit, and this is where using the valuable information found on a video heatmap can make a difference.
What is a video heatmap?
A video heatmap is a graphical representation of data with values shown in color. A heatmap provides a summary of information by synthesizing data and presenting it in visual form. Heatmaps provide a practical way to differentiate between viewers who are interested and those who are not.
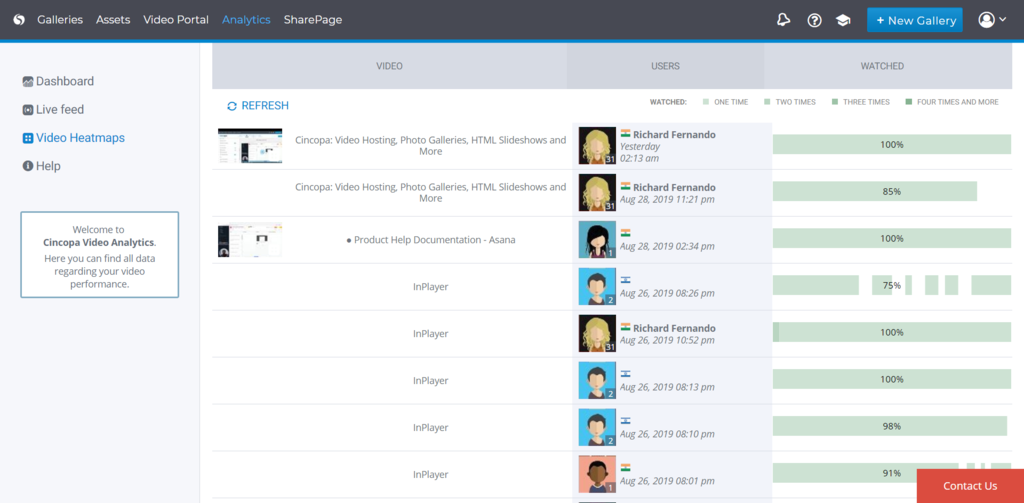
On a private hosting platform like Cincopa, every video view generates a video heatmap that shows a second-by-second view of the viewer’s behavior. The heatmap contains viewer information, contextual information, such as where and when the video was watched, and a color-coded timeline showing interaction with the video.
White, green, orange and red colors reveal the level of interaction and the ‘hotter’ the color, the greater the engagement. You can see whether viewers have skipped certain parts and rewatched others, find out how many videos viewers watched, see viewer demographics and if they clicked on a call-to-action.
Using a paid video hosting service offers many benefits that free service does not, such as increased security, customization options, and in-depth analytics, including the use of video heatmaps.
What is Heatmap iFrame API?
Cincopa provides an API to create a Heatmap that will be attached to your Cincopa videos using an iframe.
The point of this iframe is to allow other sites to show a single heatmap. A single heatmap means one visit/play from an end customer.
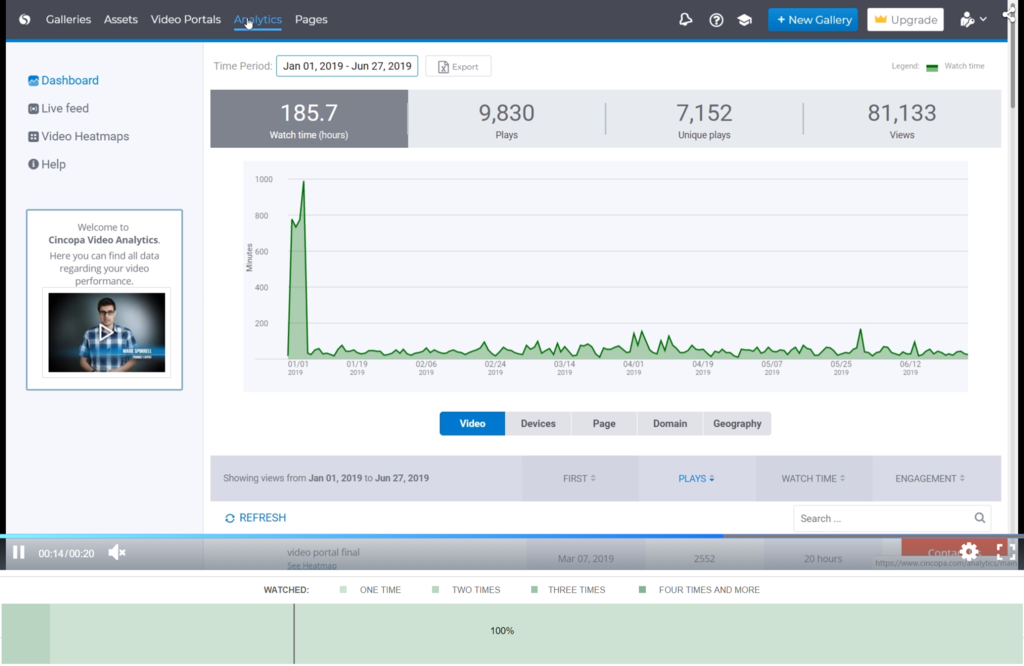
The iframe will show the heatmap at the bottom, below the actual video. When clicking on a video it will show a bar line over the heatmap to indicate the location of the play.
The color of the heatmap at the bottom will indicate the amount of time the video has been played.
How to use the Heatmap iFrame API?
To use the heatmap API you will call a URL with certain parameters.
Here’s an example of an API that can create a video with a heatmap:
To test this API, all you have to enter this URL in a browser and a video with a heatmap will be displayed as shown in the screenshot below.
To understand the API call, let’s try to understand the API URL in detail.
API URL: https://api.cincopa.com/v2/analytics.single_heatmap_iframe?api_token=1163760iou04m0qzuvzikzpb3sverp54qwe&date=” + (new Date()).toISOString().slice(0, -14) + “&zone=0&hm=” + cincopa.cp_media_hm[c.uid][c.item.rid][“hmid”] + “&uid=” + c.uid + “&disable_editor=y
From above API URL, you have replace the following option with your Cincopa video details:
(new Date()).toISOString().slice(0, -14): Here you will have to specify the date on which you want to gather the analytic data on the heatmap.
“&zone=0&hm=”:
cincopa.cp_media_hm[c.uid][c.item.rid][“hmid”]:
“&uid=”:
c.uid:
“&disable_editor=y: