Cincopa Video Analytics Live Feed has detailed information about each and every person who has watched the video with a detailed viewing heatmap and engagement rate.
You can also find additional information like the URL where that video was watched, device type, country and if identified via form, email merge tags or API – name and email address.
To access the live feed options, follow these steps:
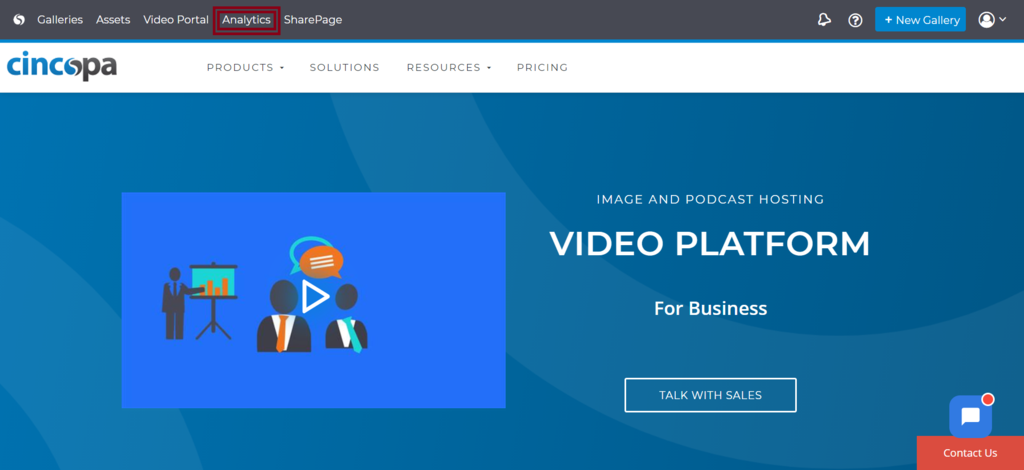
Log in to your Cincopa account and click on Analytics
Once in the Analytics page, click on Live Feed
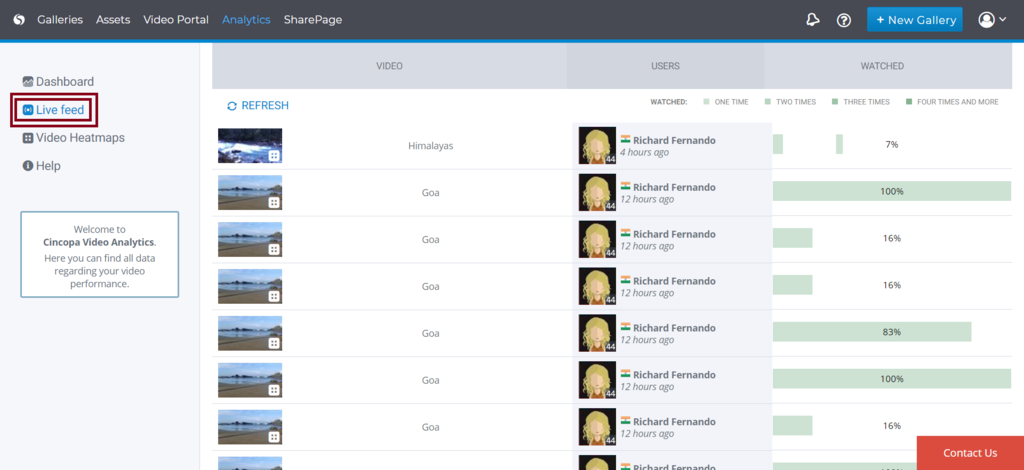
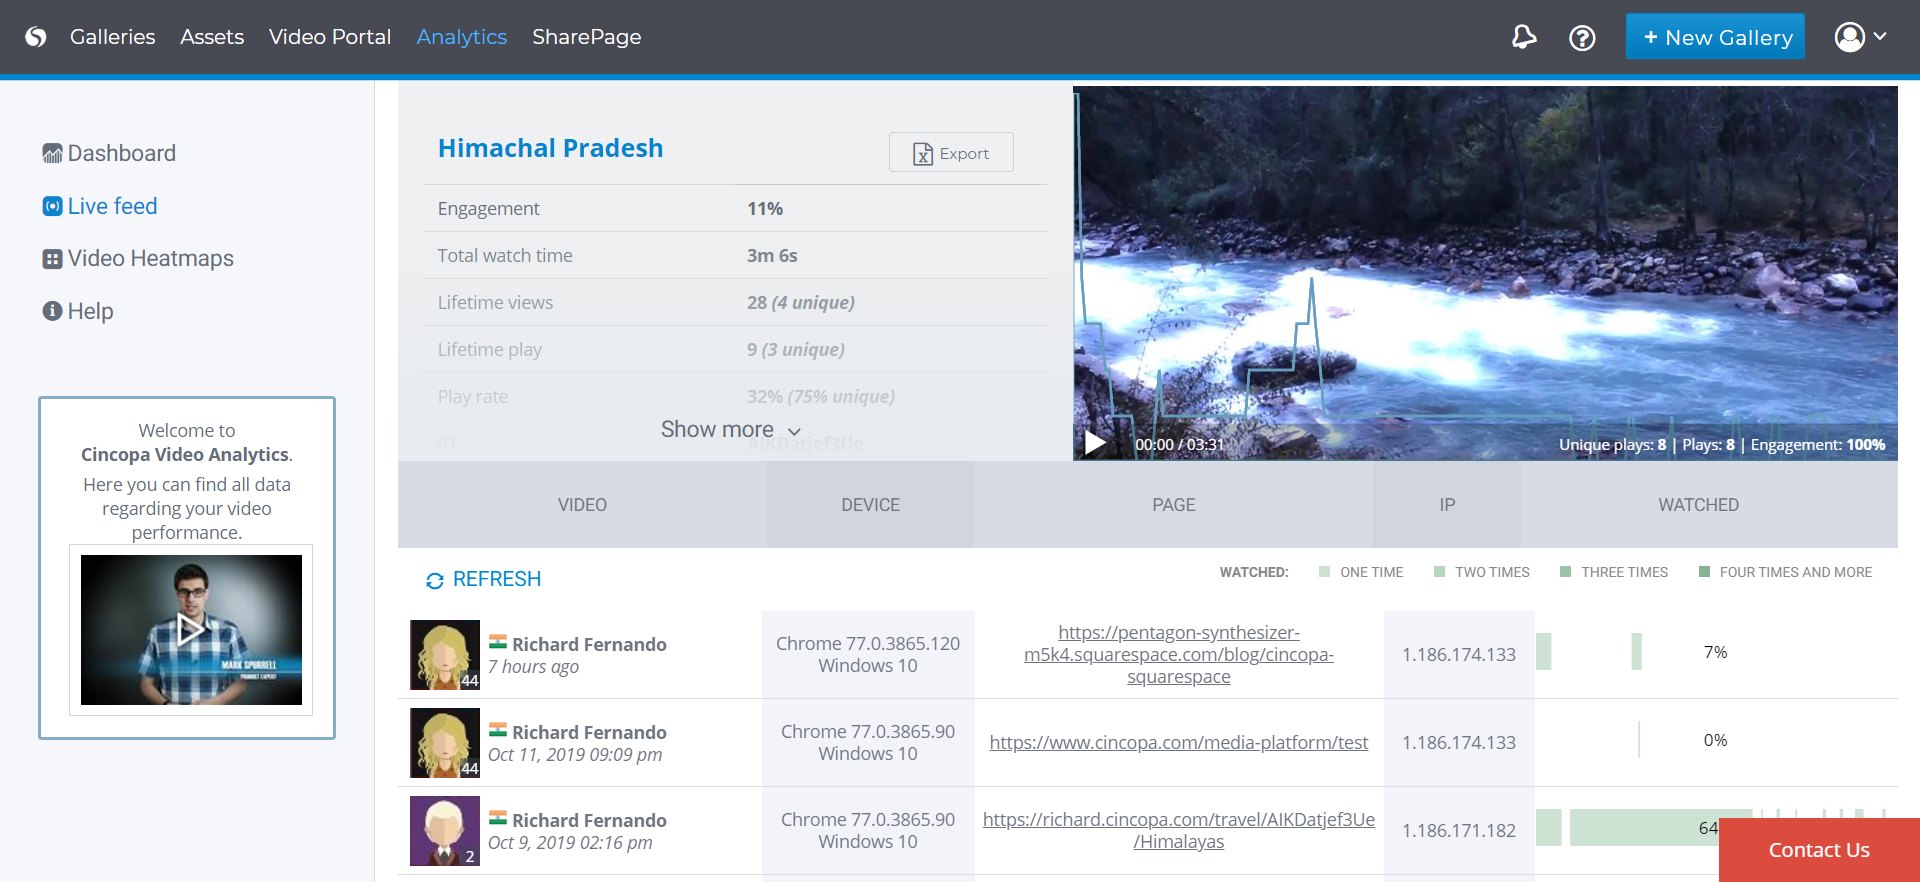
Here you will be able to see the of every view your Cincopa media content has received. On this page, you will find data divided into the following three columns: VIDEO, USERS, WATCHED.
1. VIDEO
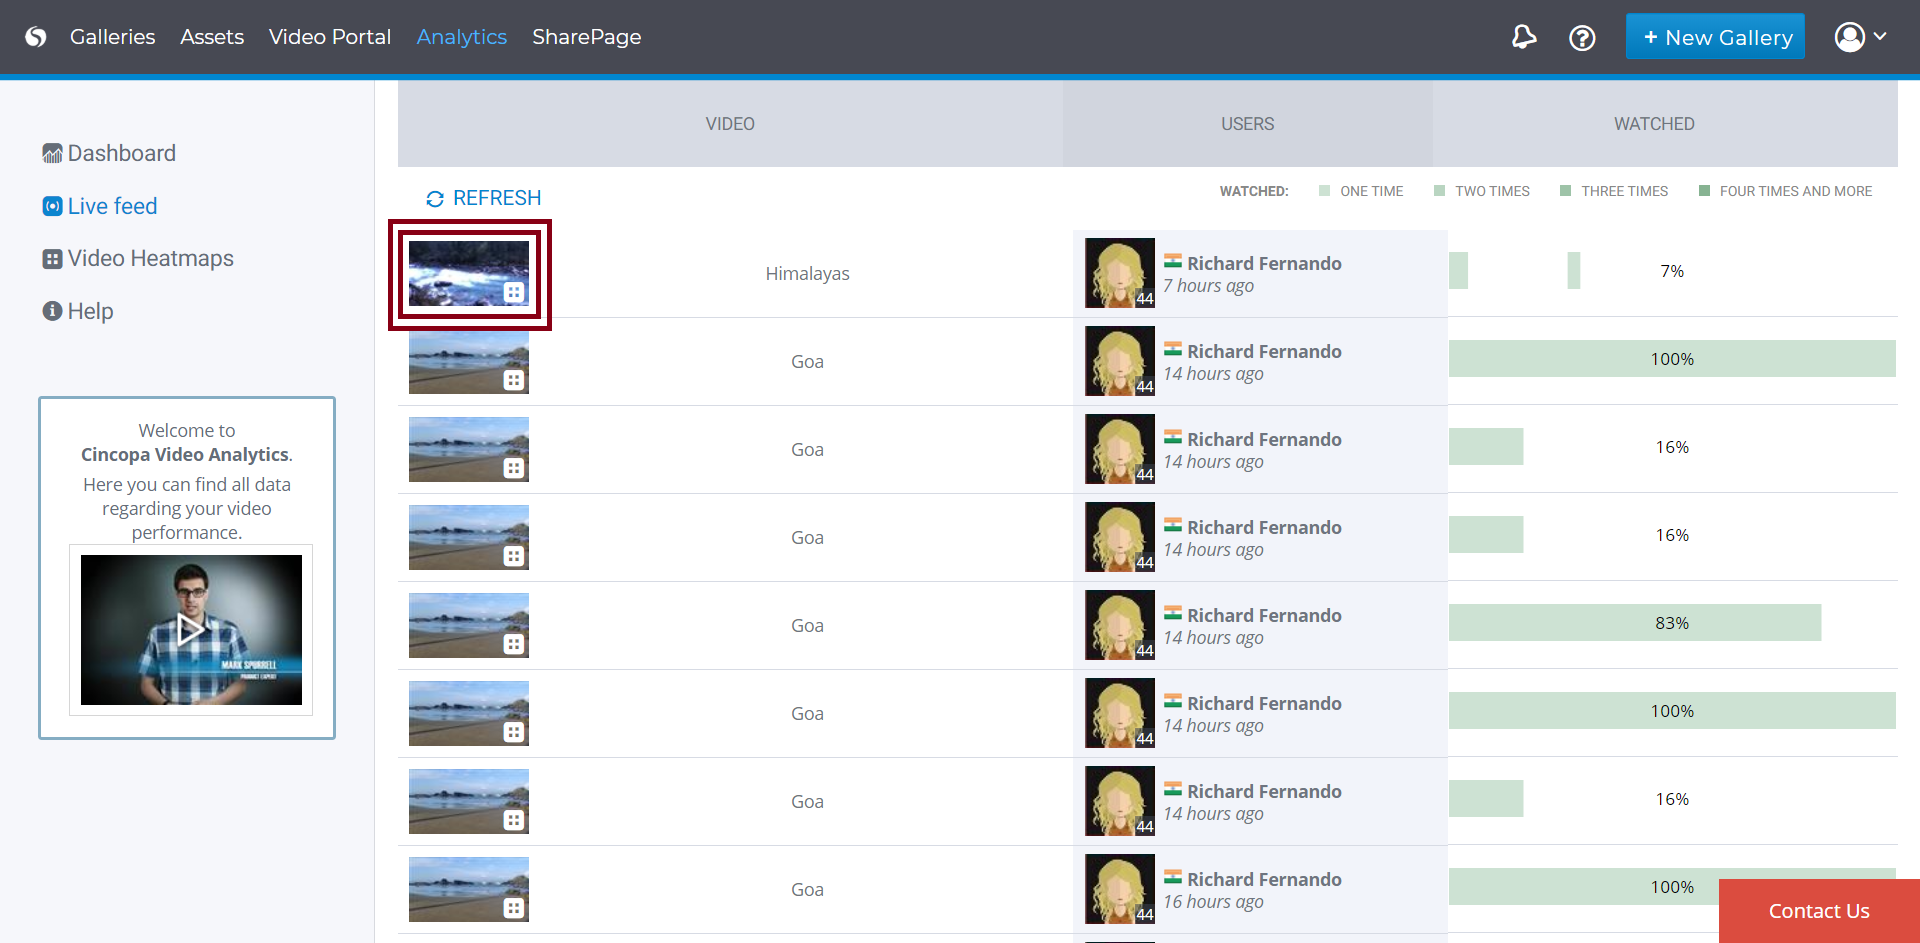
This column contains the details about your Cincopa video that has been viewed by the user. When you click on the video it will take you to the analytics details of that particular video.
For example, Let’s try to click on the first video as shown in the screenshot below.
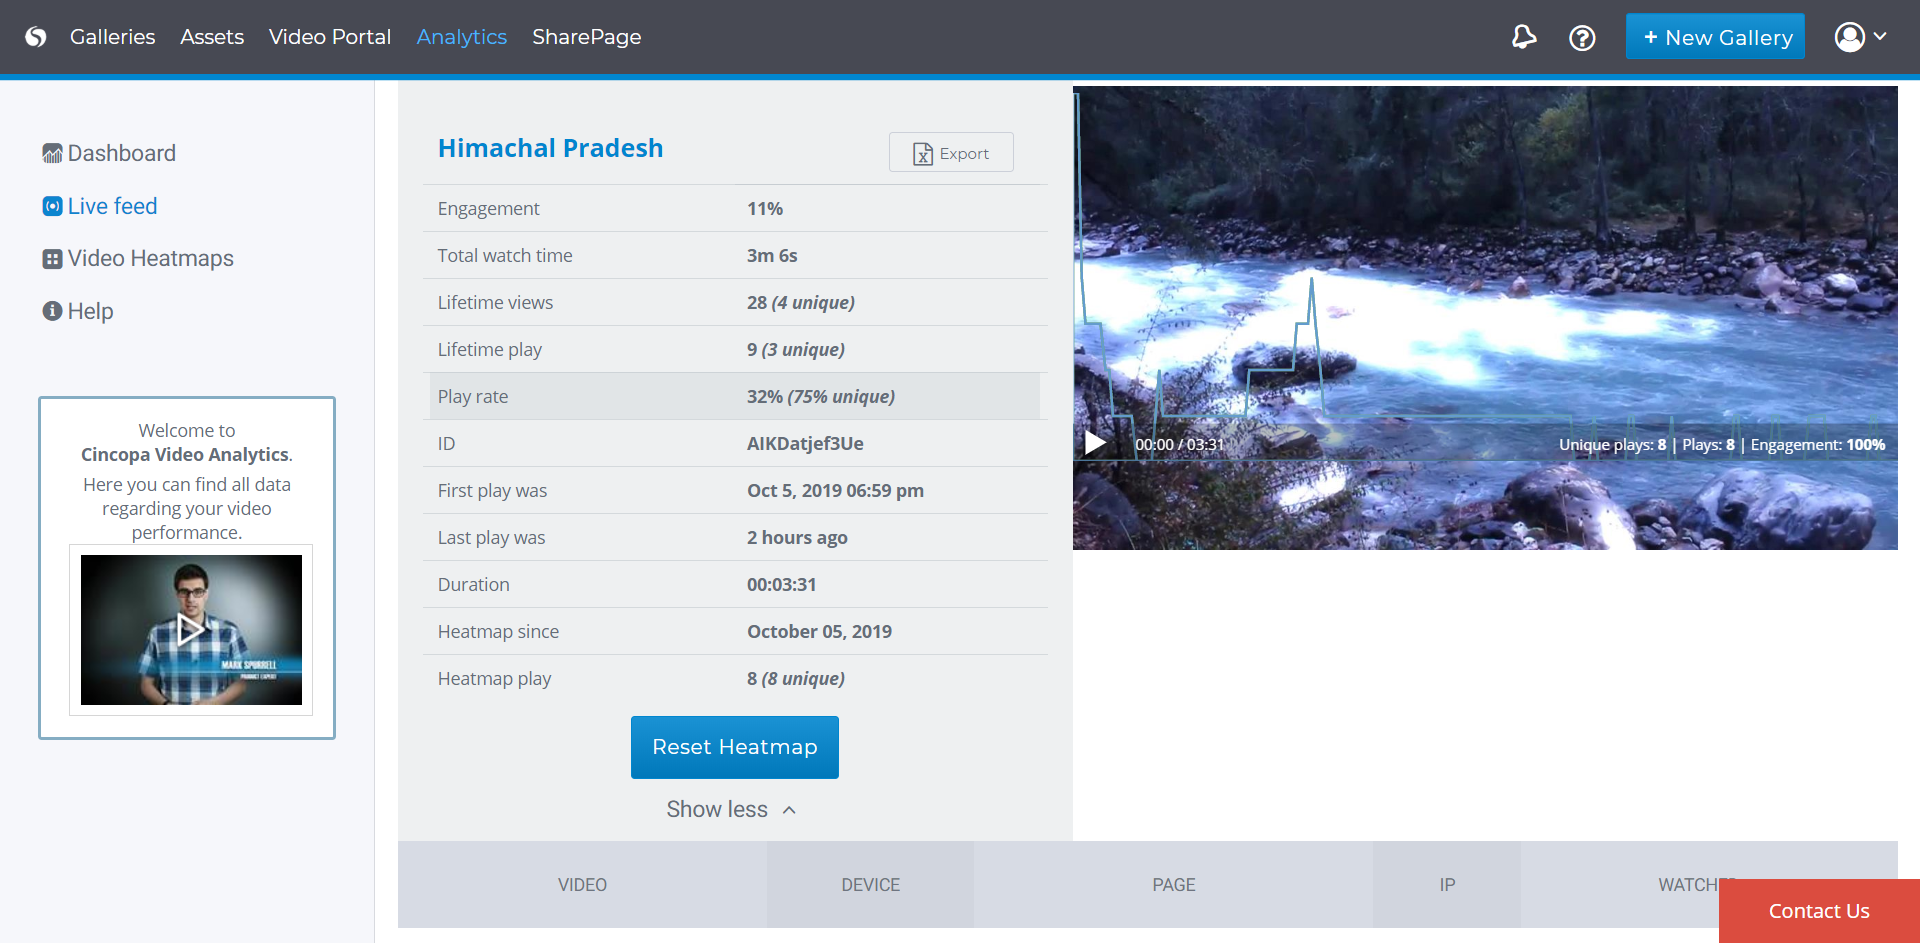
Next, you will be taken to video-specific analytics, where you can see the analytics data, video preview and details about every user who viewed the video.
The video preview section contains a graph within the video player showing data of the number of Plays, Unique Plays, Engagement, Time, etc
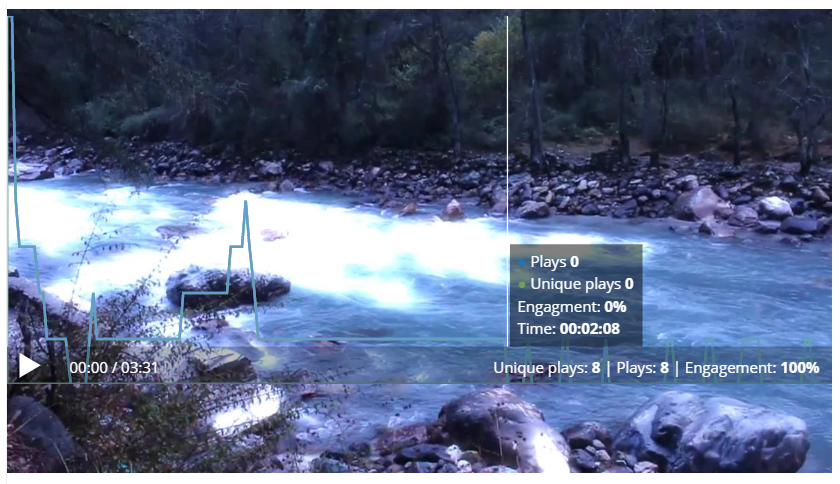
You can then click on Show more to view the analytical data.
It contains the following data:
Engagement: Video engagement is a primary insight to determine how much information viewers retained from your video.
Total watch time: This shows the amount of time the video has been watched on an average.
Lifetime Views: Total number of views the video has received so far.
Lifetime play: The total number of times the video has been played so far.
Play rate: A video’s play rate is defined as the number of people who have clicked on your video and watched it.
ID: The asset ID of the video.
First play: The date and time when the video was first played.
Last play: The date and time when the video was last played.
Duration: Here you can find how long does this video last. In other words, the playtime of the video.
Heatmap since: Shows since when is the heatmap data calculated.
Heatmap play: How many times the heatmap has been played.
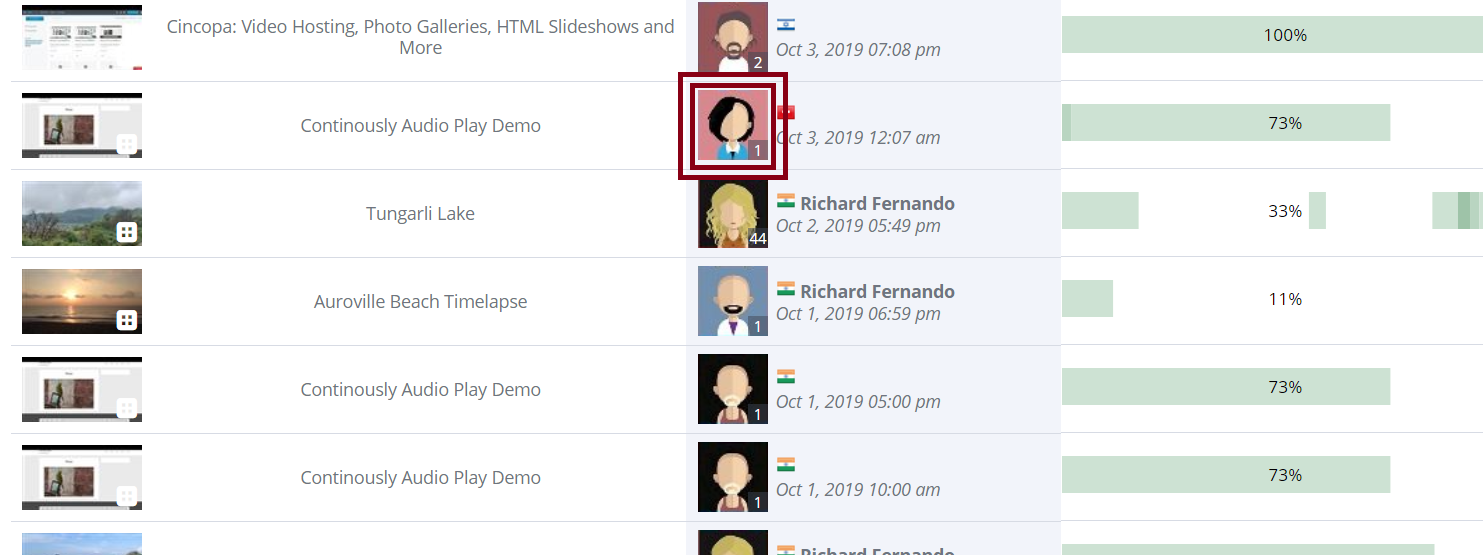
2. USERS
In this column, you will find the details of the user who viewed your video. It contains details like Country, Name, Time, etc.
To check this, let’s click on a user from the Users column.
Now you will see the user details with the following information:
Viewer: Name of the User who viewed your data.
Email: Email of the User who viewed your data.
ID: An ID created for the user viewed your data.
Viewing: How long has the viewer viewed the data.
Average Engagement: An insight to determine how much information viewers retained on average from your video.
First view / Last view: Show the date when the video was first viewed and last viewed.
From: The location where the user accessed the video from.
Platform: Which device the user has used to access the data.
Last IP: IP address of the user who viewed the data.

3. WATCHED
This shows how long the user viewed your video and it is shown in percentage. It also contains data about how many times the video has been viewed.