Cincopa Secure Video Portals is your own private “YouTube” channel, which lets you easily create a YouTube Like – fully hosted video site and customize, organize and showcase your videos in one single fully-hosted digital space which you can share as a brandable link with your audience, securing it using login restrictions or your organization’s Single Sign-On solution.
You can click here to understand how to create and customize a video portal.
How to check traffic analytics of your video portals?
Cincopa also provides you an option to analyze the traffic that you receive in your personalized video portal.
Let’s see how to achieve that with step by step explanation and screenshots. Before you check your traffic analytics make sure you have a Video Portal already created.
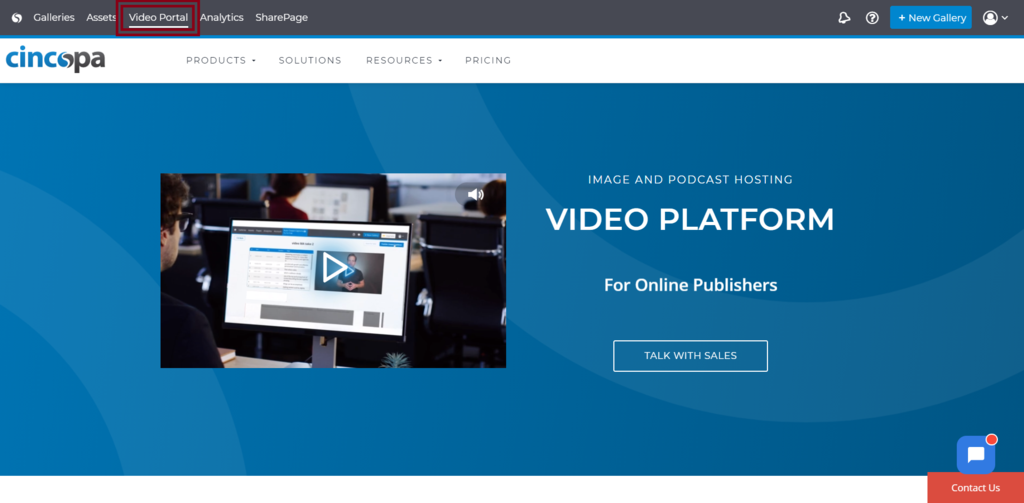
Once you have a video portal created, login to your Cincopa account and click on Video Portal to access the video portals.
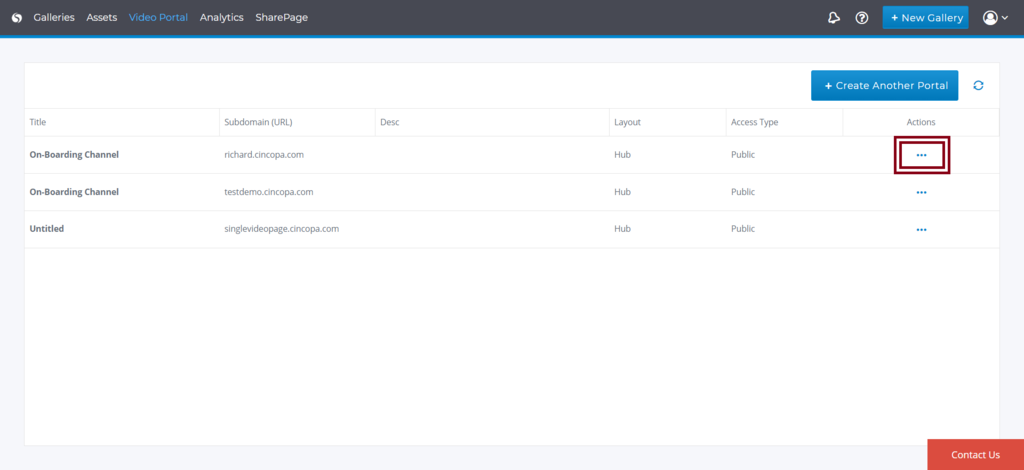
Now you will see the list of Video Portals you created. To check for more options click on the three dots as shown in the screenshot below.
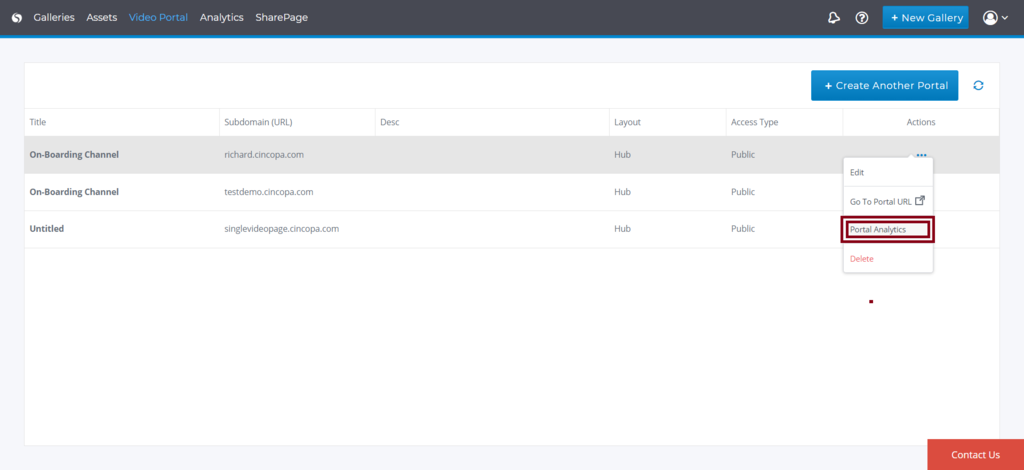
Now you can click on Portal Analytics to view the analytics data.
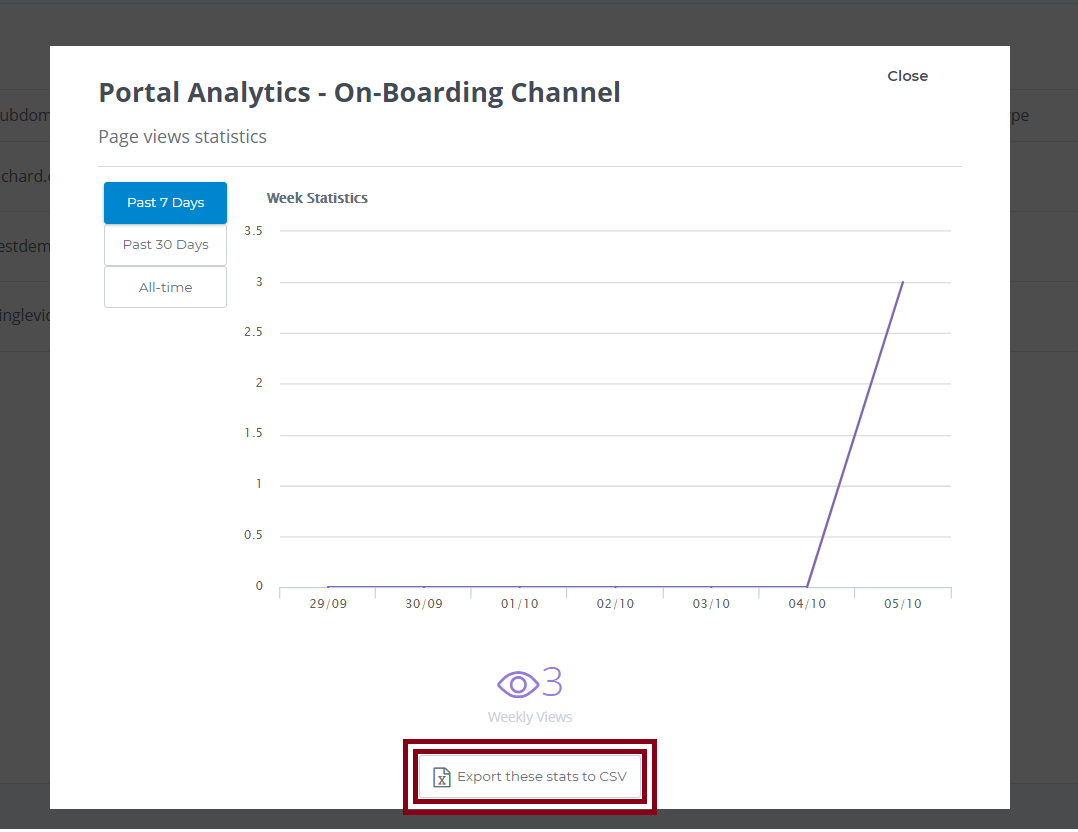
You will now be able to see the analytical data of the video portal with a graph. You can also switch between analytical data of the Past 7 Days, Past 30 Days, All-time.
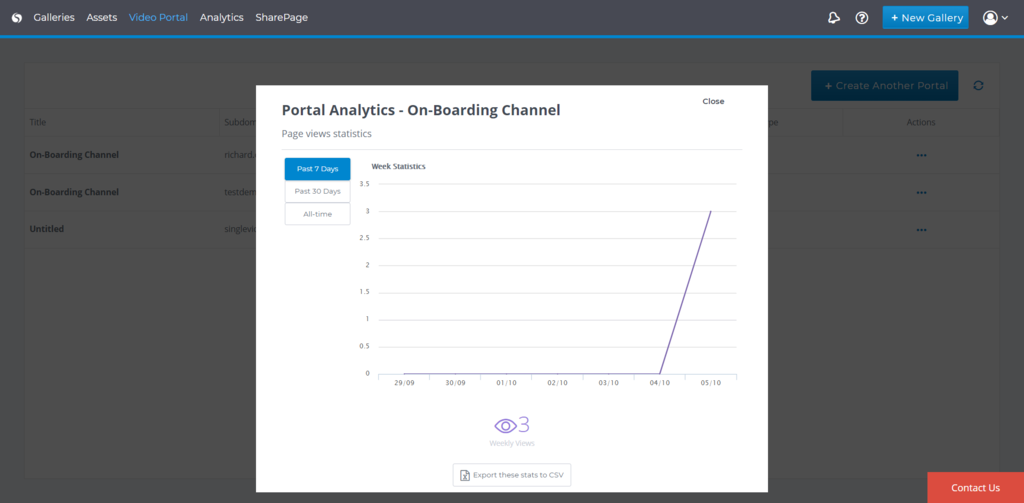
You can also export the analytical data that you see here to use for external use. To export the analytical data in CSV format, simply click on Export these stats to CSV