Understanding how your audience interacts with your video content is a key-component en route to successful marketing. With Cincopa’s new Video Analytics, you can be sure that your videos not only look great, but also deliver excellent marketing results. The results will always depend on how well you comprehend viewers’ preferences and use this intelligence to create really engaging video content.
We’re excited to introduce Video Analytics, the ultimate source of stats and insights into online video performance. Video Analytics is now available to all Cincopa users. It’s powerful, yet very easy to use, so you’ll be able to start analyzing your videos and improving your marketing strategy right away.
Cincopa Video Analytics: Quick Overview
Video Analytics has several sections, providing different sorts of insights.
-
Dashboard
This section shows aggregated video stats within a selected timeframe. For your convenience, data is presented in a graph, which is a perfect way to comprehend how video stats change in dynamics.
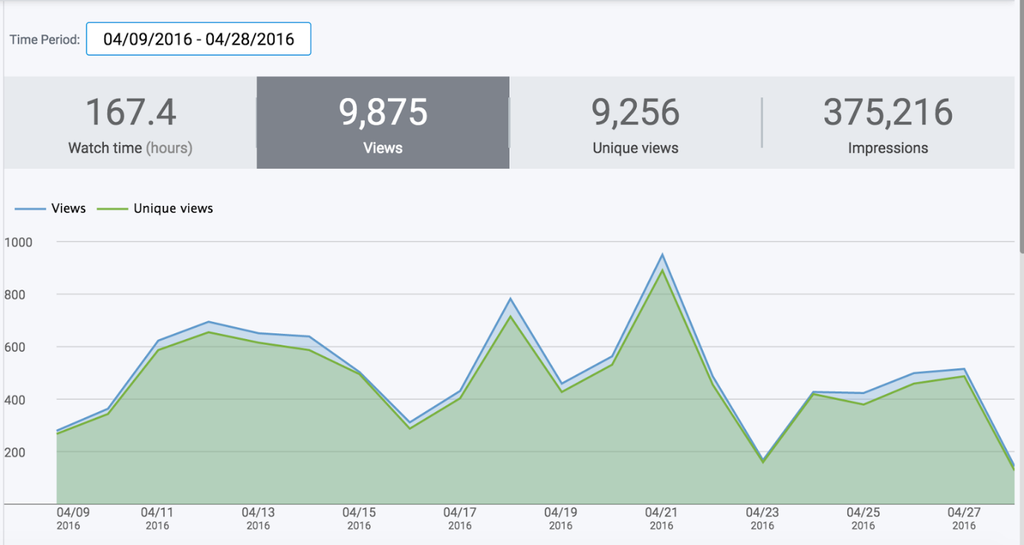
Watch time shows the total viewing time of all videos in hours. Views are recorded each time a user plays a video. Unique views refer to the number of unique users who have played videos. The Impressions graph is helpful in understanding how many times web pages containing your embedded videos have been loaded by users.
Below the graph, there is a table with detailed stats. You can sort them by video, page, domain, and geography. Check out heatmaps showing how user-engagement changes for each video from start to end.
-
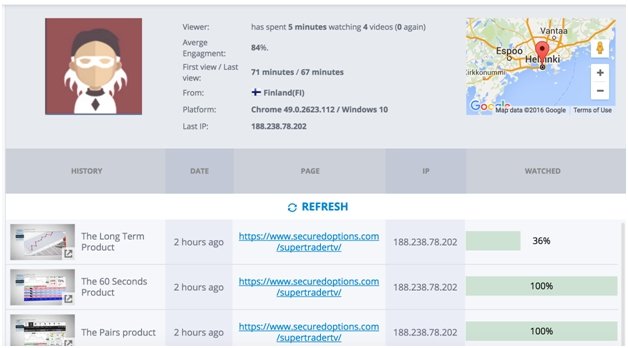
Live Feed
Here, you can gain access to detailed information about each and every user who has watched your video. This info includes his country, view date, video asset name, web page where the video was played, IP, and engagement.
-
Help
It’s very easy to get started with Video Analytics. Visit the help section which provides a step-by-step guide through all of its essential features. Still have questions? Contact our team at support@cincopa.com