Online businesses have the advantage of tracking their traffic and customers with few clicks. Cincopa allows you to track your galleries with Google Analytics, in order to study your visitors’ online behaviour and to make strategic changes to your website, if needed.
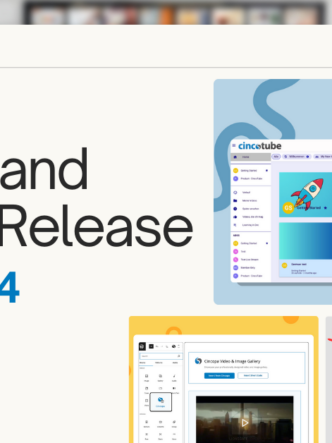
So, dear Cincopians, no need to despair, we are here to help: You can now easily get more statistics about your gallery using Google Analytics. The feature is available for all the responsive skins (you can find them marked with the responsive icon).
![]()
Why is Google Analytics beneficial for your website?
No matter what is the domain of your business, or the multimedia assets that you are having listed in your galleries, Google Analytics will increase your insight about your performance and it will provide you with tools for achieving positive results – no matter what your goals are.
- it shows where your traffic is coming from and why – find out if your galleries’ traffic is coming from search engines, linked websites, newsletters, sales leads and get detailed reports, segmented for any of your requests.
- it determines the worth of your marketing efforts – If you are spending too much money on marketing, while you are promoting your galleries, the Google Analytics tool can help you improve your strategies, by suggesting better keywords or bids.
- it uncovers what your users like/dislike about your product – see your most visited assets within your galleries, the most favourite pages, the most shared files. In addition, check what is not working so well and adapt your content strategy accordingly.
- it finds out if your site works properly – web monitoring tools allow you to verify if your media assets are in order, if you don’t show any “ 404” pages or if you don’t have links sending to non-existing media assets.
- it teaches you about your visitors – Understanding your customers allows you to prospect better the information you want to share with them. In addition, tracking potential users, can help you cross-market your business and it helps you improve your galleries’ traffic. Google Analytics can help you monitor the leads as well, for example how many people download your free music sample or the free imaged offered for subscribing to your Cincopa gallery or following your social media platforms.
How to enable and use the Google Analytics feature with your Cincopa galleries
First of all, select a relevant skin (don’t forget, it has to be responsive). After that, on Custom skin page, go to the Misc tab and enable the Google Analytics feature. After completing that, on Google Analytics check the Events under the Behavior menu.

The relevant event category is Cincopa Galleries, under this category the event action for each gallery is by name and ID, for example:


Under every action you will find labels with the actual info about the gallery usage, such as: video play, photo open, gallery view etc.

Easier that this it cannot get! Now you are all set for tracking your Cincopa’s galleries with Google Analytics. Have fun!