Many of our users have the need to collect analytical data for a variety of purposes.
Cincopa has very powerful analytics tools where the user can see the viewer’s engagement with content in order to differentiate between viewers who are interested and those who are not. To learn more about these features please consult the following articles:
Moreover, users that need to perform additional analysis of the viewer’s data have the ability to download all of the data collected by Cincopa. You can use this tool to gather data for the month period and may change the collection dates within this period.
Let’s learn how to extract all of the analytical data!
- Log into your Cincopa Account or Sign up for a new Cincopa Account
- In the menu at the top of your Cincopa profile, select Analytics. You will be taken to the Analytics Dashboard
Note: make sure you have created and shared at least one gallery with customers or colleges in order for this information to populate
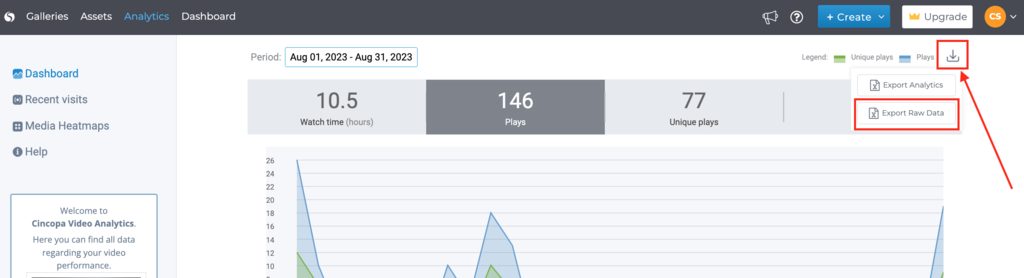
Raw Analytical data can be exported for a period of 31 days at a time. You can change the date range, however, you can’t collect more than 31 days per export.
To get the data you need, adjust the time period, and select the Export Raw Data button.
This will download a CSV file that contains all of the analytical data in the date range you have selected.
If you like to access and process this data directly from your server without the need to download it manually everytime, just right-click on the Export Raw Data and choose “Copy link address“. This URL can be downloaded using a server side script and be processed on your server. Note that the date range that you’ve selected is encoded in this URL in a relative terms meaning that if you choose to download the last week then this URL will download the last week even in the future. This allows you to use the same link on your server side.
Column name – Description:
- time – UTC time
- hmid – This is the specific heat map Id
- ckid – This is the viewer unique Id. This is how Cincopa identify the user
- unique – true if this is the first time this ckid is watching this video, false if not
- ud_email -user-defined email
- ud_acc_id – account id
- ud_name – account name
- prg – how many seconds were watched in total
- lat and long – latitude and longitude of the viewer (by his IP)
- IP- viewer IP address
- rid – video ID
- country, city – the country and city of the viewer (by his IP)
- dur – total length of the video in seconds
- URL – URL where the video was watched
- ua – the browser’s User-Agent
- name – the name of the video
- hm – a comma-separated list of rangers in seconds that indicates which parts of the video this viewer has watched. Each value can also be a range for example “10-20,30-40” means that user watched from second 10 to 20 and then skipped to second 30 and watched until second 40 (total of 11 seconds). In case, a user watched a specific second or a range more than one time then a colon will be used for example “10-20:2,21-30,31:3” means that user watched second 10 to 20 twice, 21-30 one time and second 31 was watched 3 times.
In order to calculate what percentage of the video user actually watched you can take the total unique seconds (seconds that were watched at least once) and divided by the dur (duration) value. For example in “10-20:2,21-30,31:3” total watched seconds were 11+10+1=22. Assume that the dur of the video was 40 seconds then 22/40=55%.
Here is a javascript function to calculate unique seconds and the total_percentage_watched:
function calc_unique_seconds(hm) {
   var totaluniqueseconds = 0;
   var pair = hm.split(",");
   for (var i = 0; i < pair.length; i++) {
      var prange = pair[i].split(":");
      var range = prange[0].split("-");
      if (range.length == 1)
         totaluniqueseconds++;
      else
         totaluniqueseconds += parseInt(range[1]) - parseInt(range[0]) + 1;
   }
   return totaluniqueseconds;
}

var total_percentage_watched = calc_unique_seconds("10-20:2,21-30,31:3") / 40;
Note that the same email can appear under more than one ckid if the viewer is using multiple devices to view the content (ex. Desktop and Mobile)