What metrics or key performance indicators are most important to your business? When it comes to content marketing its important to find out whether your creative efforts and promotional tactics are paying off.

76% of B2C brands and 88% of B2B brands use content marketing. With such high level of competition, using analytics to your advantage will ensure that you are engaging your audience and achieving your set targets.
Data should guide your decisions as a content marketer, just as it does with every other aspect of your business. It makes the difference between blindly generating content, based on intuition, and creating strategies based on solid information.
Ask the right questions when looking at the data
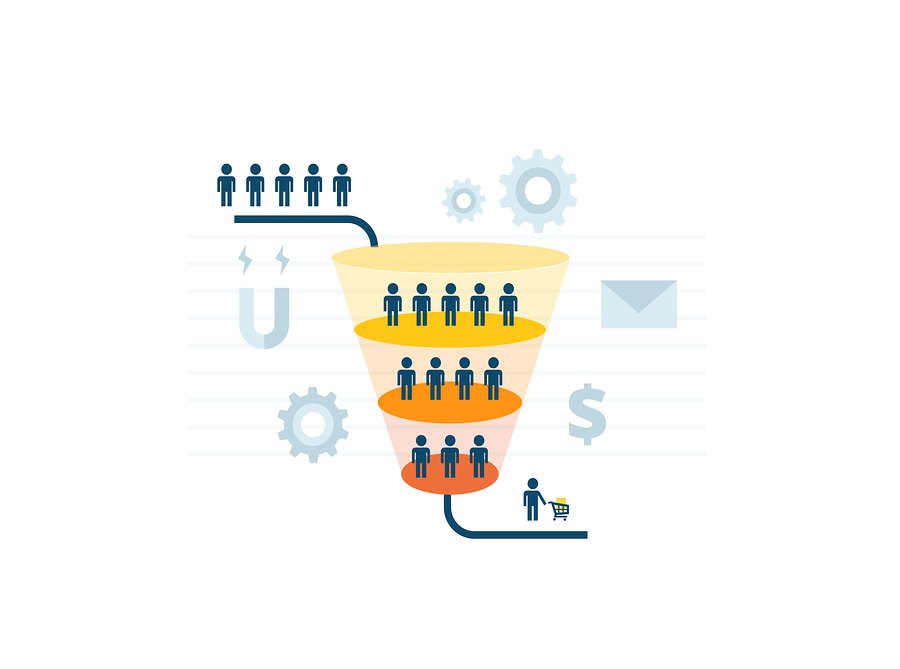
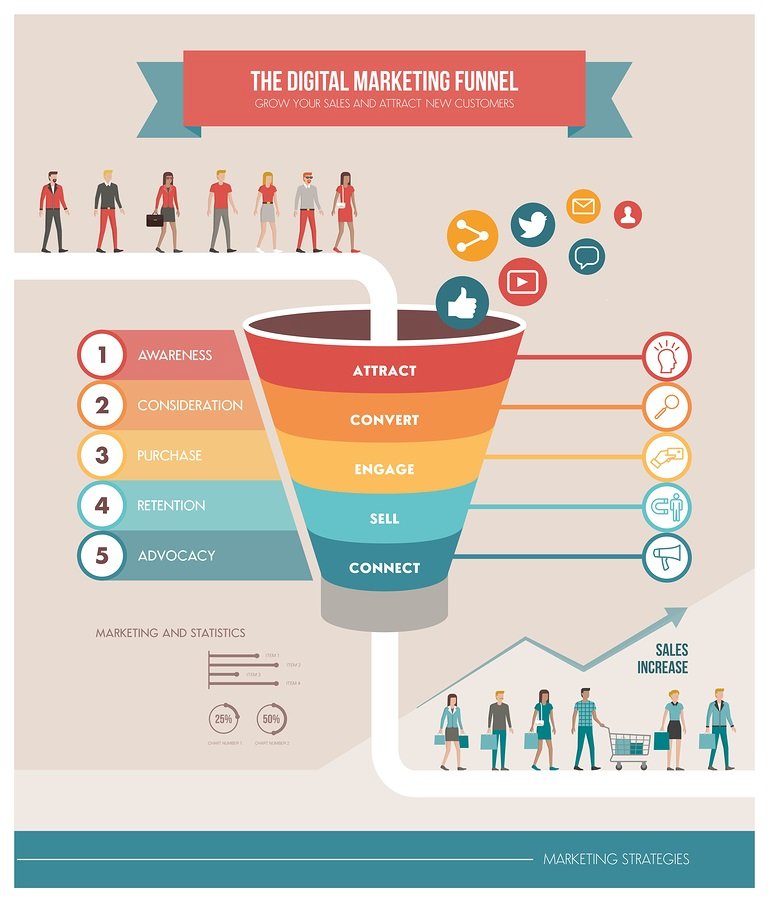
All your content should be created with a specific goal in mind. It should align with your audience at the different stages of the marketing funnel, from initial awareness through to conversion.

Is your content is meeting your goals? If not, what improvements can you make? When looking at data, you should be asking yourself these questions:
- Are my current content marketing efforts effective?
- Are there content marketing opportunities I am missing?
- Am I managing to engage consumers and retain them?
- What types of content are most effective at attracting high-value leads?
- Does the data suggest any new content marketing ideas?
What analytics should I focus on?
When looking at your editorial calendar, everything from your types of content, titles, publication times and days, content categories and more should be subject to data interrogation.
It’s helpful to have a table showing each post you publish, its key information, and your chosen performance indicators (site visits, social shares, conversions, etc.). Once you’ve gathered all the data, you can formulate it into a report to inform your content marketing strategies.
Consumption
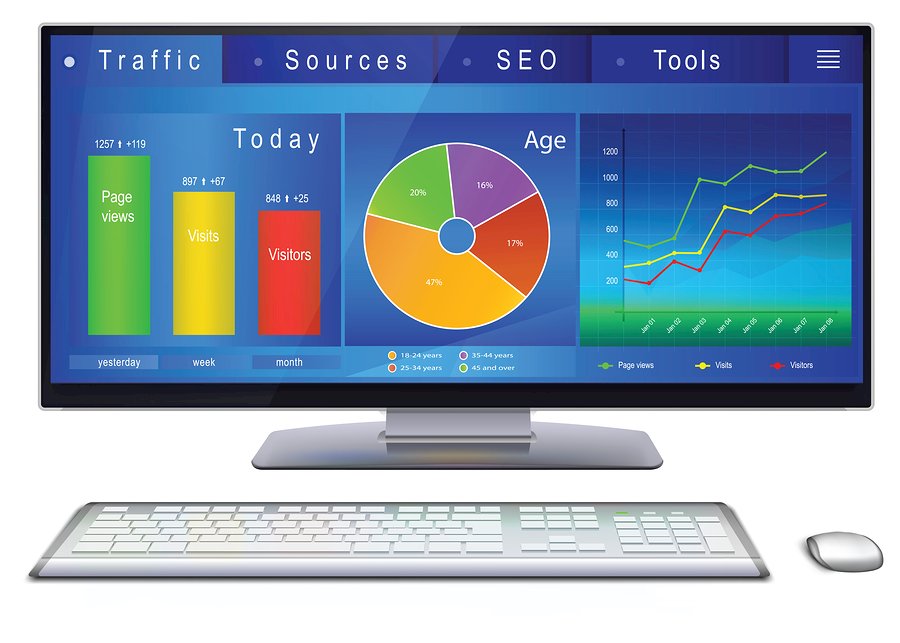
Consumption metrics will tell you how many people are reading or viewing your content, what channels they are using and how frequently and with what depth they consume it.
The most important consumption metrics for your website are page views, unique visitors and the average time spent on a page. Google Analytics or a similar web or video analytics tools give you this data.
Consumption can also refer to video or visuals and then the video metrics that you need to look at are video views, unique views, and avg. view duration.
- Page views – tells you how many and which content pages are read.
- Unique visitor analytics – tells you how much of your traffic is repeat visitors.
- Average time spent on page – tells you whether people are skimming content or reading it more thoroughly.
When considering time spent on a page, test how much of a difference it makes when you make certain changes. For example, post a how-to video on the page and note the difference. By using Google Analytics content experiment, Kapitall increased conversions by 44%.
Using the comparison feature in Google Analytics can help you discover which posts are attracting traffic but users don’t convert. Go to behavior>site content>landing pages. You will see the comparison feature on the right side of the screen. Choose goal conversion rate from the drop-down menu.

Work on improving pages that are getting high traffic but lower than average conversions. As the traffic to these pages is high, the impact of any improvements you make is greater than what you’d see with low traffic pages.
Use site search behavior to get ideas for new content
If you’ve set up Google Analytics correctly, your site search behavior is available. Looking at the list of search terms may give you ideas you hadn’t even thought about. If you do a time comparison, you may find trends you can utilize because it will give you the most popular search terms. This, of course, should be complemented by using keyword research tools.
Sharing
Sharing metrics tell you whether your content is being shared, who is sharing it and how, where and how often they are sharing. People will share your content if it’s useful, educational or entertaining in some way.
Various tools, such as SharedCount, can give you consolidated data on the number of Social Media Shares across all social media platforms.
Social media data is important to help you make a wide range of decisions, such as what content performs best. You can use key metrics from Facebook Insights, for example, to see best performing posts, post reach and engagement rates.

Social data can also give you important audience insights. You can use audience profiling tools to gain more insight into other types of content your readers engage with to help you create new content and give your topics highly like to interest your audience.
Engagement
Consumption and sharing should translate into engagement or video engagement. Does your content inspire users to take some form of action? What action are they taking and how frequently and consistently do they take action?
Session duration or dwell time
In Google Analytics, go to audience>behavior>engagement to measure how long visitors stay on your website.
Page depth
Tells you how many pages your visitors go to per session. Do they just read one piece of content and leave?
One of the metrics you can look at to gauge audience engagement is comments on a post. The amount of traffic you have hardly matters if you can’t keep visitors engaged and convert them into customers.
Low engagement may result from many different reasons. If you know what type of content creates the most engagement, you can focus on producing those types of content. For example, you may find that e-commerce content creates more engagement than other content types.
If you pay attention to what motivates your leads most, you’ll have feedback to keep you publishing content that converts. For example, simply changing the personality of your promotional video from professional to casual could increase engagement.
If you know when engagement rates are higher, you can post more content on those days.
Leads
Content marketing generates 3X more leads compared to outbound marketing and costs 62% less. After all the efforts that you put in your marketing campaign, harnessing the leads are important.
Lead metrics help you track and measure middle-of-the-funnel activities. You should be able to attribute your leads to specific content. The easiest way to associate content with leads is to use a marketing automation platform to set up campaign tracking. The process may be complex but the insights you can gain make it worthwhile.
Being able to track in this way lets you know how many leads generated a specific piece of content and also whether the leads resulted in further actions.

If the leads coming in are more qualified based on engaging with your content, your content strategy is working. When you’ve implemented campaign tracking, you can also generate reports to analyze campaigns. You can answer questions such as:
- How many new leads did a specific piece of content generate?
- What content converted leads lower into the funnel?
- How many existing leads consumed a specific piece of content?
- Are there specific areas of the funnel lacking content?
Retention
Retention metrics can show you how successful you are at retaining the attention of your audience after initial contact. On your website or blog, you can use Google Analytics to measure:
Percentage of returning versus new visitors
You want a good mix of new and returning visitors. You may be attracting new visitors, but few of them return. You may have visitors that return, but you’re falling short at bringing in new visitors.
Bounce Rate
Bounce rates measure retention within a single visit. Many marketers use the bounce rate to gauge user engagement, but it has some limitations. With the Google Tag Manager, it’s easy to implement user engagement tracking and to see how long someone spent consuming your content by using Scroll Depth Tracking.
If you find that people are only engaging for a short while, you may have to consider ways to increase their interest, such as adding an entertaining video or infographic to your content. A company like Brafton is a good example of a content marketing agency that has been around for a long time, with a solid reputation.
Number of visits and days since the last visit
On Google Analytics, you can also see the number of visits, and how long it was since the last visit, a less commonly used statistic.
On social media, the main way to check retention is if people ‘’follow’’ you. Most social media platforms offer some form of analytics to track audience engagement.
When it comes to email marketing, Opt-outs and unsubscribes show you how many subscribers you are losing. New subscribers show how your email list is growing. If you’re losing more subscribers than you’re gaining, you may need to make some changes, such as reducing the frequency of your emails and creating more engaging content.
Sales
These metrics show you how your content influences bottom-of-the-funnel results? How does your content drive revenue? Ultimately, content marketing should drive sales success.
Can you attribute sales directly to individual pieces of content? According to various top marketers, if you can’t attribute revenue to a single piece of content, you’re not marketing correctly. A company’s revenue is the ultimate metric. Content marketers have to deliver measurable value to a company.

With that being said, the most important metric for measuring the success of your content is how it measures up to the specific goal you’re pursuing. Content marketing programs deliver results in many areas that create value for a business, including thought leadership.
Conclusion
Having data at your fingertips in the form of reports can change your content marketing efforts. Using the data to refine components of your strategy can boost performance. By continuing to analyze your performance over time, you can constantly improve and draw in more traffic, more engagement, more conversions, and more customers.