By 2022, video will account for 82% of all web traffic.
If you are in any way involved with marketing, you know the opportunities that this future entails.
But to truly capitalize on this trend, you will need to master (or at the very least familiarize yourself with) video analytics.
Arguably one of the most important aspects of video analytics is video heatmaps.

What Are Video Heatmaps?
Online video platforms are incredibly fragmented. This is to the point that relatively intuitive terms like ‘view’ and ‘engagement’ have different meanings depending on the platform in question. Even if a ‘view’ were to be universally defined, it would still leave a crucial aspect of video marketing unaddressed:
How to go about differentiating the quality of views.
Before diving deeper, it’s important to gain a true grasp over ‘video engagement‘. There’s no consensus definition of engagement, just as the ‘success’ of a marketing campaign can have different meanings depending on the team or organization.
A good way to think of it is how well a certain message resonates with viewers. Play rate, CTR or, more commonly, views are some of the more definitive metrics teams employ to define engagement.
“The existence of video heatmaps is almost exclusively meant to help teams reach their engagement potential.”
Thus, video heatmaps are defined as a color-coded chart (a graphical representation) demonstrating how viewers interact with your video. Most platforms represent this data as a colored linear timeline of every second of your video. Heavier interaction is marked using darker colors, while little to no interaction is represented using little to no color (white, in most cases).
Online platforms vary greatly with how they represent heatmaps.
For the purposes of gaining a true understanding of video heatmaps, we’ll examine how Cincopa does it.
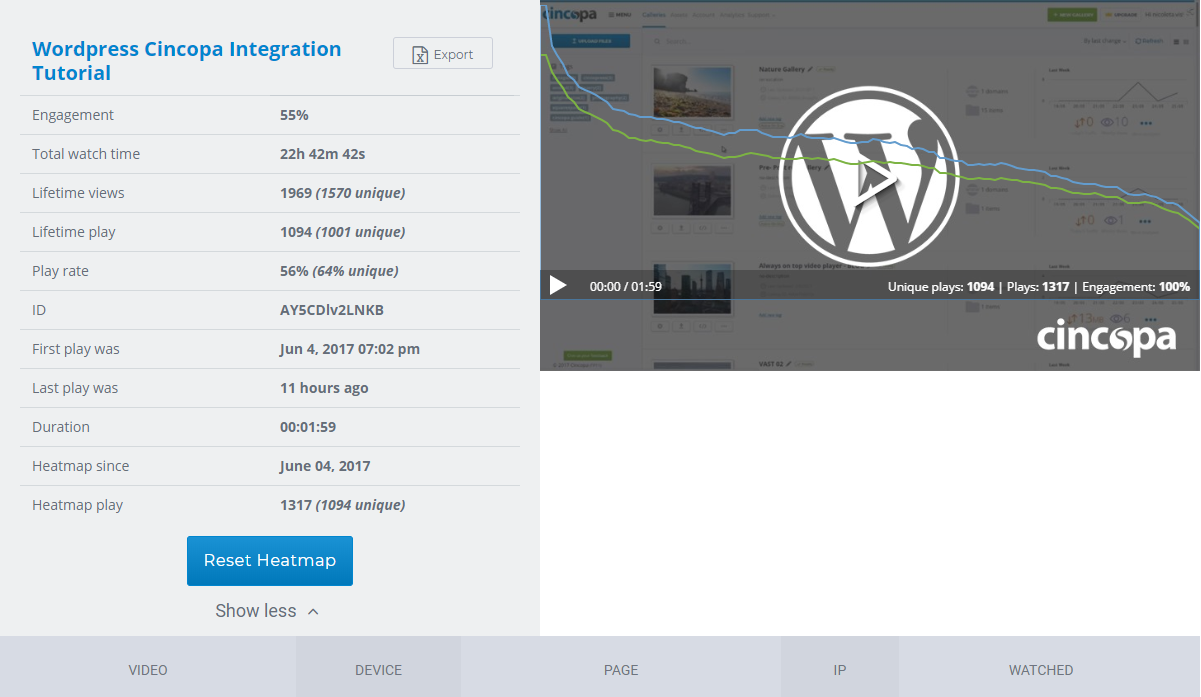
How Do Heatmaps Work?
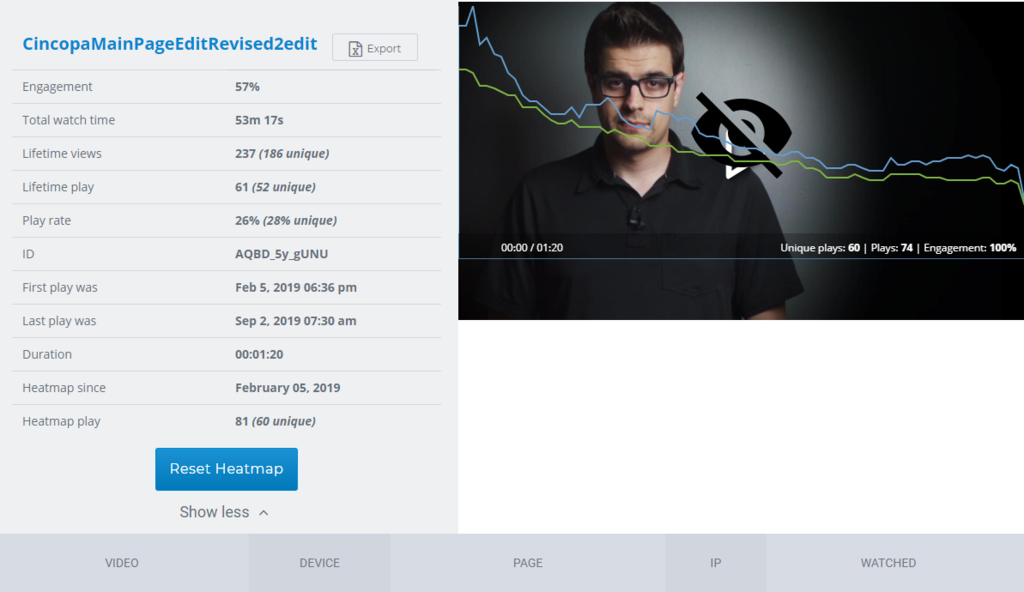
Heatmaps provide a visual representation of the way users interacted with a video over a period of time. Different kinds of interactions are usually recorded, depending on what your platform counts as an event. A light green shade normally means the person has watched the video once in the segment.
Darker shades indicate that the video was rewatched, and no color means the viewer skipped over that portion. If the colors don’t extend all the way to the end, it means the viewer probably stopped watching your video at that point.
“A heatmap may also record other kinds of data. For example, it may take note of a user that entered their email in a prompted or clicked-on an annotation.”
It’s important to understand that heatmaps were originally meant to track individual users. However, ‘aggregated heatmaps’ or ‘combined heatmaps’ allow for tracking group and segment patterns.
These take all the data that was collected to create your heatmaps, and represents them in a single, average plot. That way, a dark segment might mean more people watched it, while lighter segments imply lower interaction rates with your target audience.
How Video Heatmaps Help with Lead Generation and Conversion
The most useful feature of video heatmaps is breaking down how engaged users are with your platform – visually. Rather than be forced to settle for a single perspective regarding what engagement is, you’re free to decide on your own.
This allows you to filter out users that view your video for just a few seconds, or, alternatively, it helps you find out why they aren’t more engaged. You can then gain valuable insight into which portions of your videos need changes.
Encouraging engagement
Engaged viewers are a lot easier to convert into paying customers.
Video heatmaps come into play by helping you identify where engagement-enhancing features are supposed to be placed. Once you know where viewers are most likely to be paying attention to your video, or where they are most likely to abandon it, you can get users to respond to your content.
For example, right before where most users tend to abandon your video, you could add a turnstile to collect emails or an annotation prompting them to watch more videos. If your videos have a high completion rate, you might encourage your users to leave a comment or share the video.

Modifying your marketing strategy
Having gained insight on how your viewers respond to content, you should start changing different aspects of your marketing strategy. A sudden abrupt fall in the number of people that view your video may mean that a lot of your viewers don’t relate to what’s happening in the video at that exact point.
Missing chunks of viewing time by different viewers might also tell you people aren’t interested in what you have to say at that point. You might be taking too long to get to the meat of what you have to say. Then again, the information you’re relaying might just be too complex or overwhelming.
Segmenting Visitors Into Categories
As it often happens, people visiting your website are going to fall into one of several different categories, depending on how they interact with your videos. A person taking a cursory approach to your website could be a visitor somewhere on the open end of the marketing funnel, exploring the different solutions the market has to offer.
Such a visitor will likely only watch certain sections of your video, rather than the whole thing. On the other hand, prospects positioned further down the sales funnel are more likely to watch (or re-watch) your video in an attempt to see if it fits their use case.
“The data collected on identified users should be passed to relevant teams so they can adjust various aspects of the campaign. This might enable your teams to treat visitors further down the sales funnel differently on repeat visits than first-time visitors by showing them the CTA earlier, for instance.”
A/B Testing
A/B testing happens when you randomly show some of your users different videos, for instance, to see how well they respond.
For a lot of marketers, the true value of marketing strategies is click-through rate (CTR). This is the percentage of users that click on your call to action (CTA). Your CTA might be encouraging users to click a link or signing up for a promotion. Video heatmaps are useful for a marketer looking to experiment with different positioning of their CTA.
A common occurrence, for example, is that users either respond better to a CTA placed at the start or end of a video. After reviewing your heatmaps, you might find that your users don’t often watch the video to the end, prompting you to move your CTA to a different spot in the video.